This is a version of a paper I presented at the University of Kansas Digital Humanities Seminar, Co-Sponsored with the Hall Center for the Humanities on September 17, 2018.
Good afternoon, and thank you everyone for coming today. Thanks especially to the Digital Humanities Seminar and the Medieval and Early Modern Seminar for inviting me today, and to Peter and Elspeth for being such excellent and kind hosts.
What I’d like to do today is present an overview of some of my current work on how to think about manuscripts and digitized manuscripts, and and to present some newer work, all of which I must warn you is still in a bit of an embryonic state. I’m hoping that we have time in Q&A to have a good discussion, and that I might be able to learn from you.
First, a bit about me so you know where we’re starting.
I am a librarian and curator at the Schoenberg Institute for Manuscript Studies (SIMS), which is a research and development group in the Kislak Center for Special Collections, Rare Books and Manuscripts at the University of Pennsylvania. I’ve been at Penn, at SIMS, for a little over five years, when SIMS was founded. The work we do at SIMS is focused broadly on manuscripts and on digital manuscripts, particularly but not solely medieval manuscripts – we have databases we host, we work with the physical collections in the library, we collaborate on a number of projects hosted at other institutions. Anything manuscript related, we’re interested in. My place in this group is primarily that of resident digital humanist and digital librarian – and let me tell you, these are two different roles.
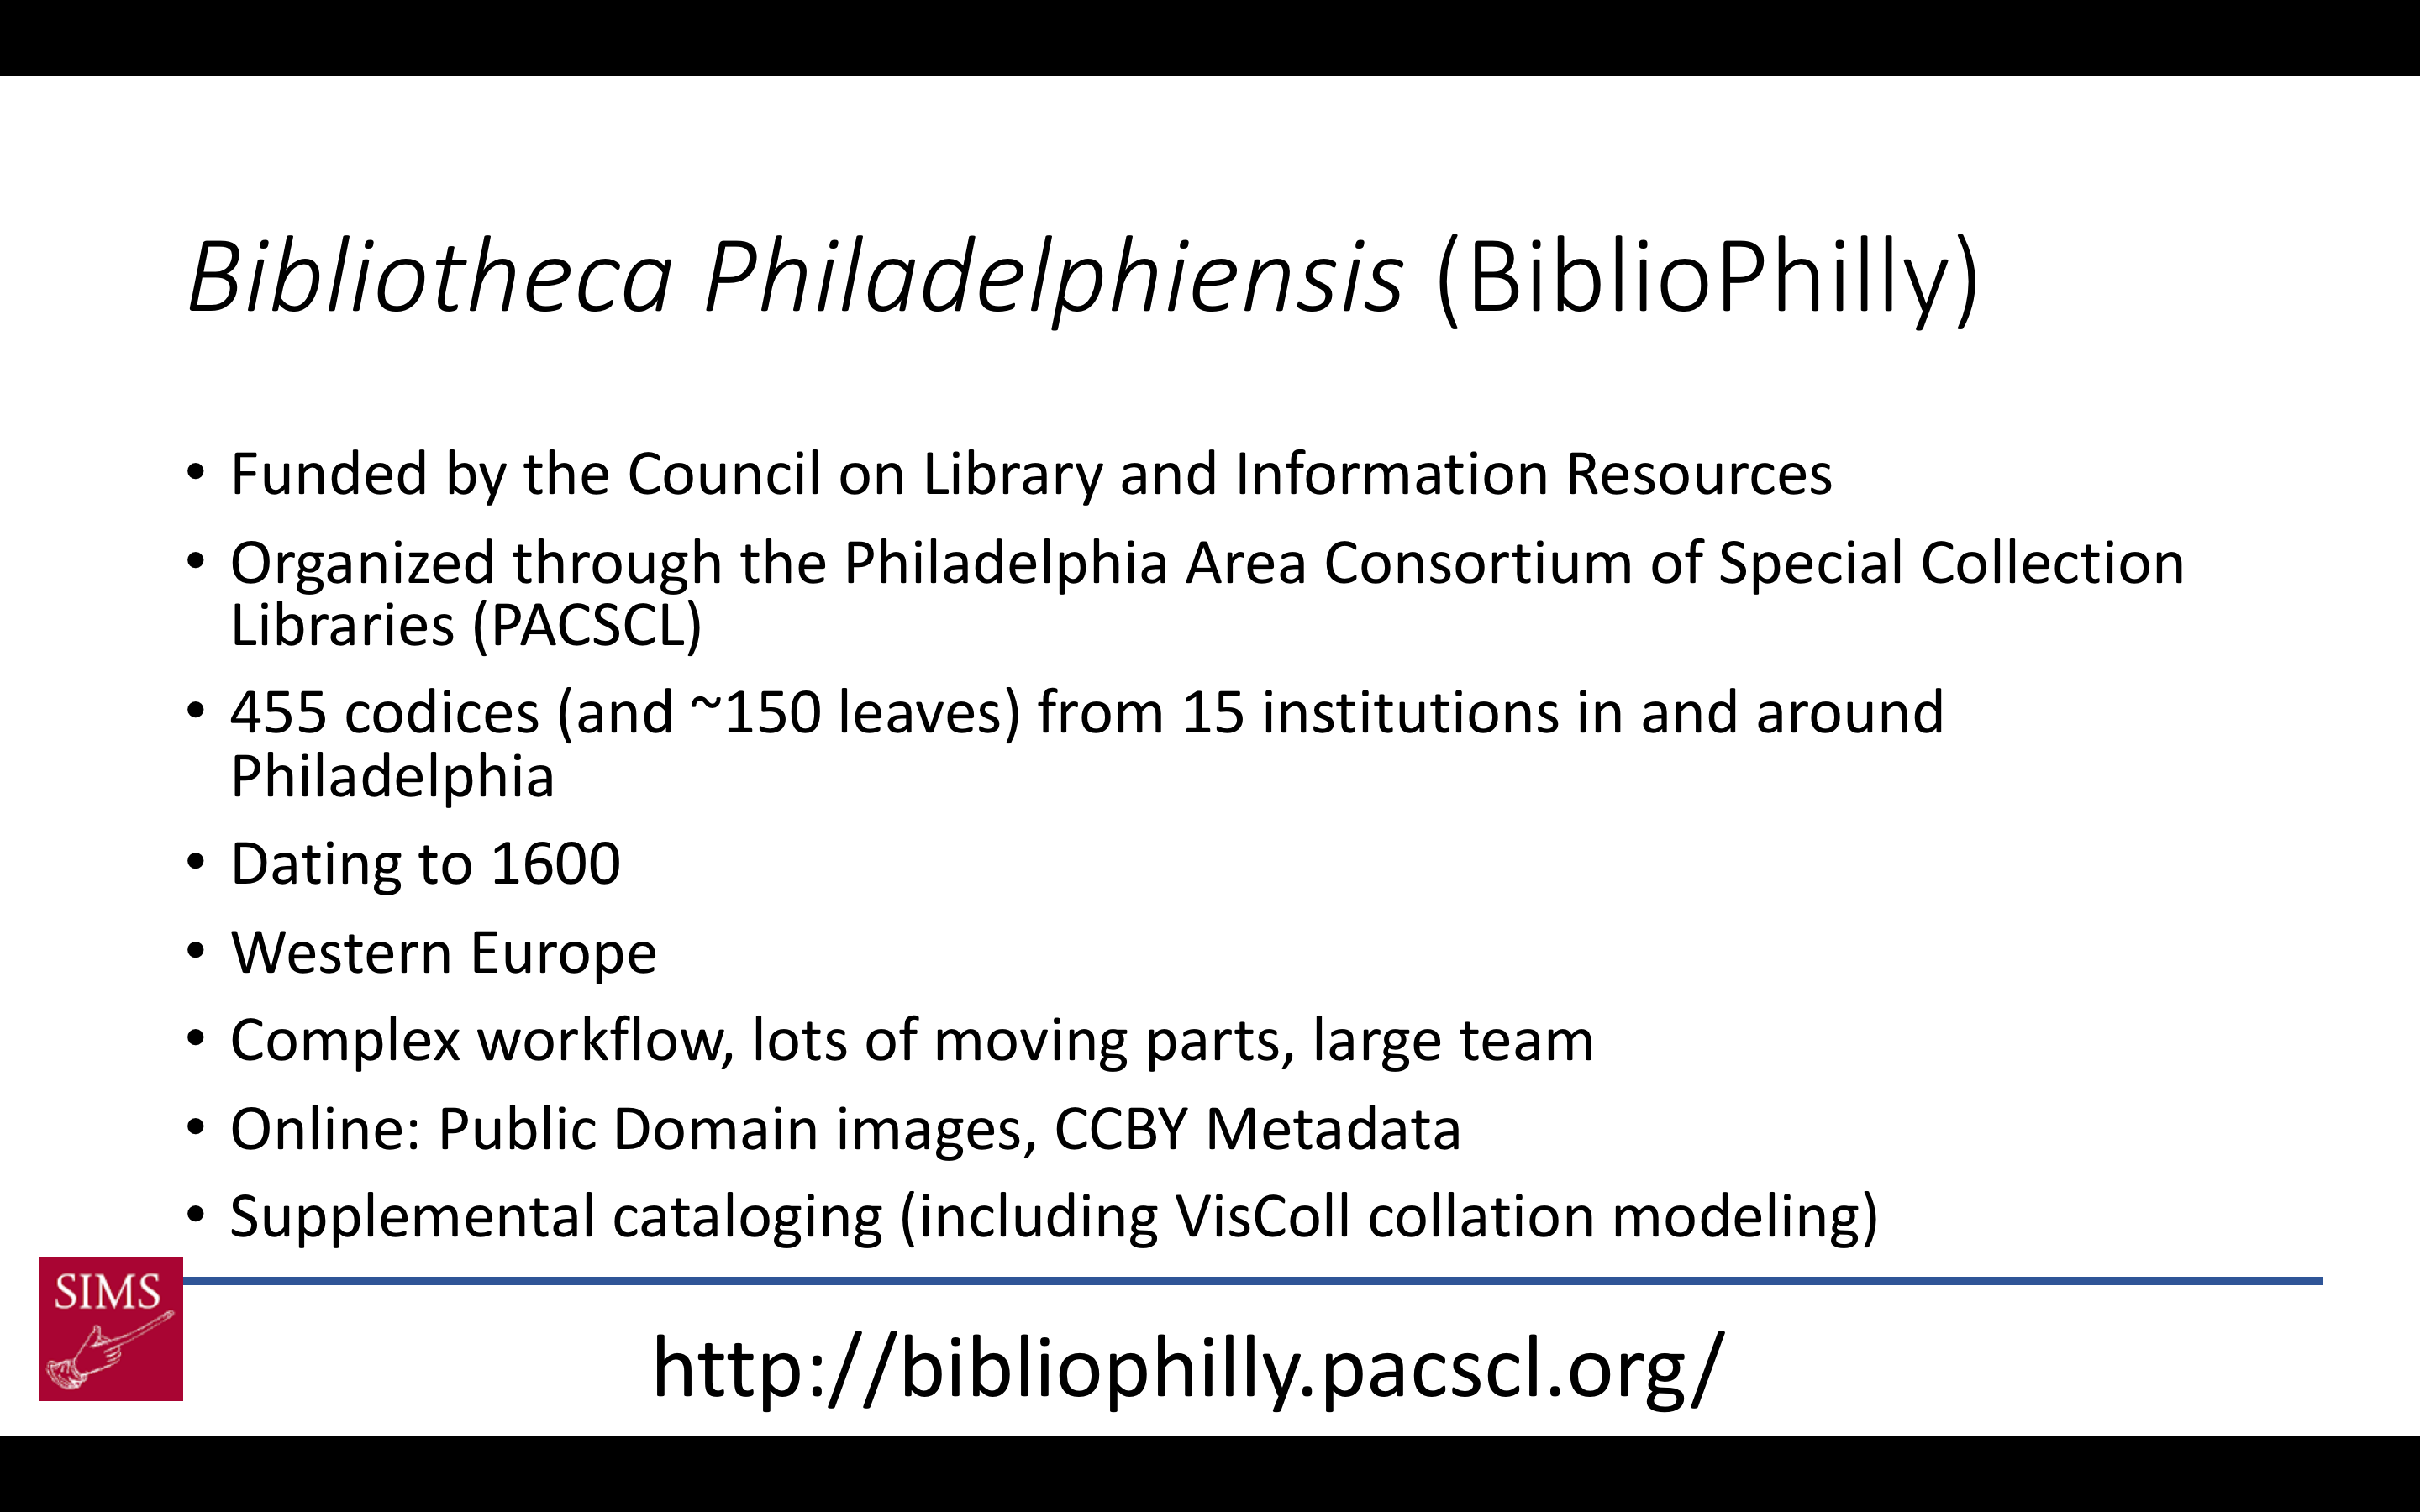
At the moment, in my librarian role, I’m co-PI of a major project, funded by the Council on Library and Information Resources, to digitize and make available the western medieval manuscripts from 15 Philadelphia area institutions – about 475 mss codices total. We call this project Bibliotheca Philadelphiensis, or the library of Philadelphia – BiblioPhilly for short. The work I’ve been doing so far on this project is largely related to project management: making sure the manuscripts are being photographed on time, that the cataloging is going well (and at the start we had to set up cataloging protocols and practices). The manuscripts are going online as they are digitized, in the same manner that all our manuscripts do:
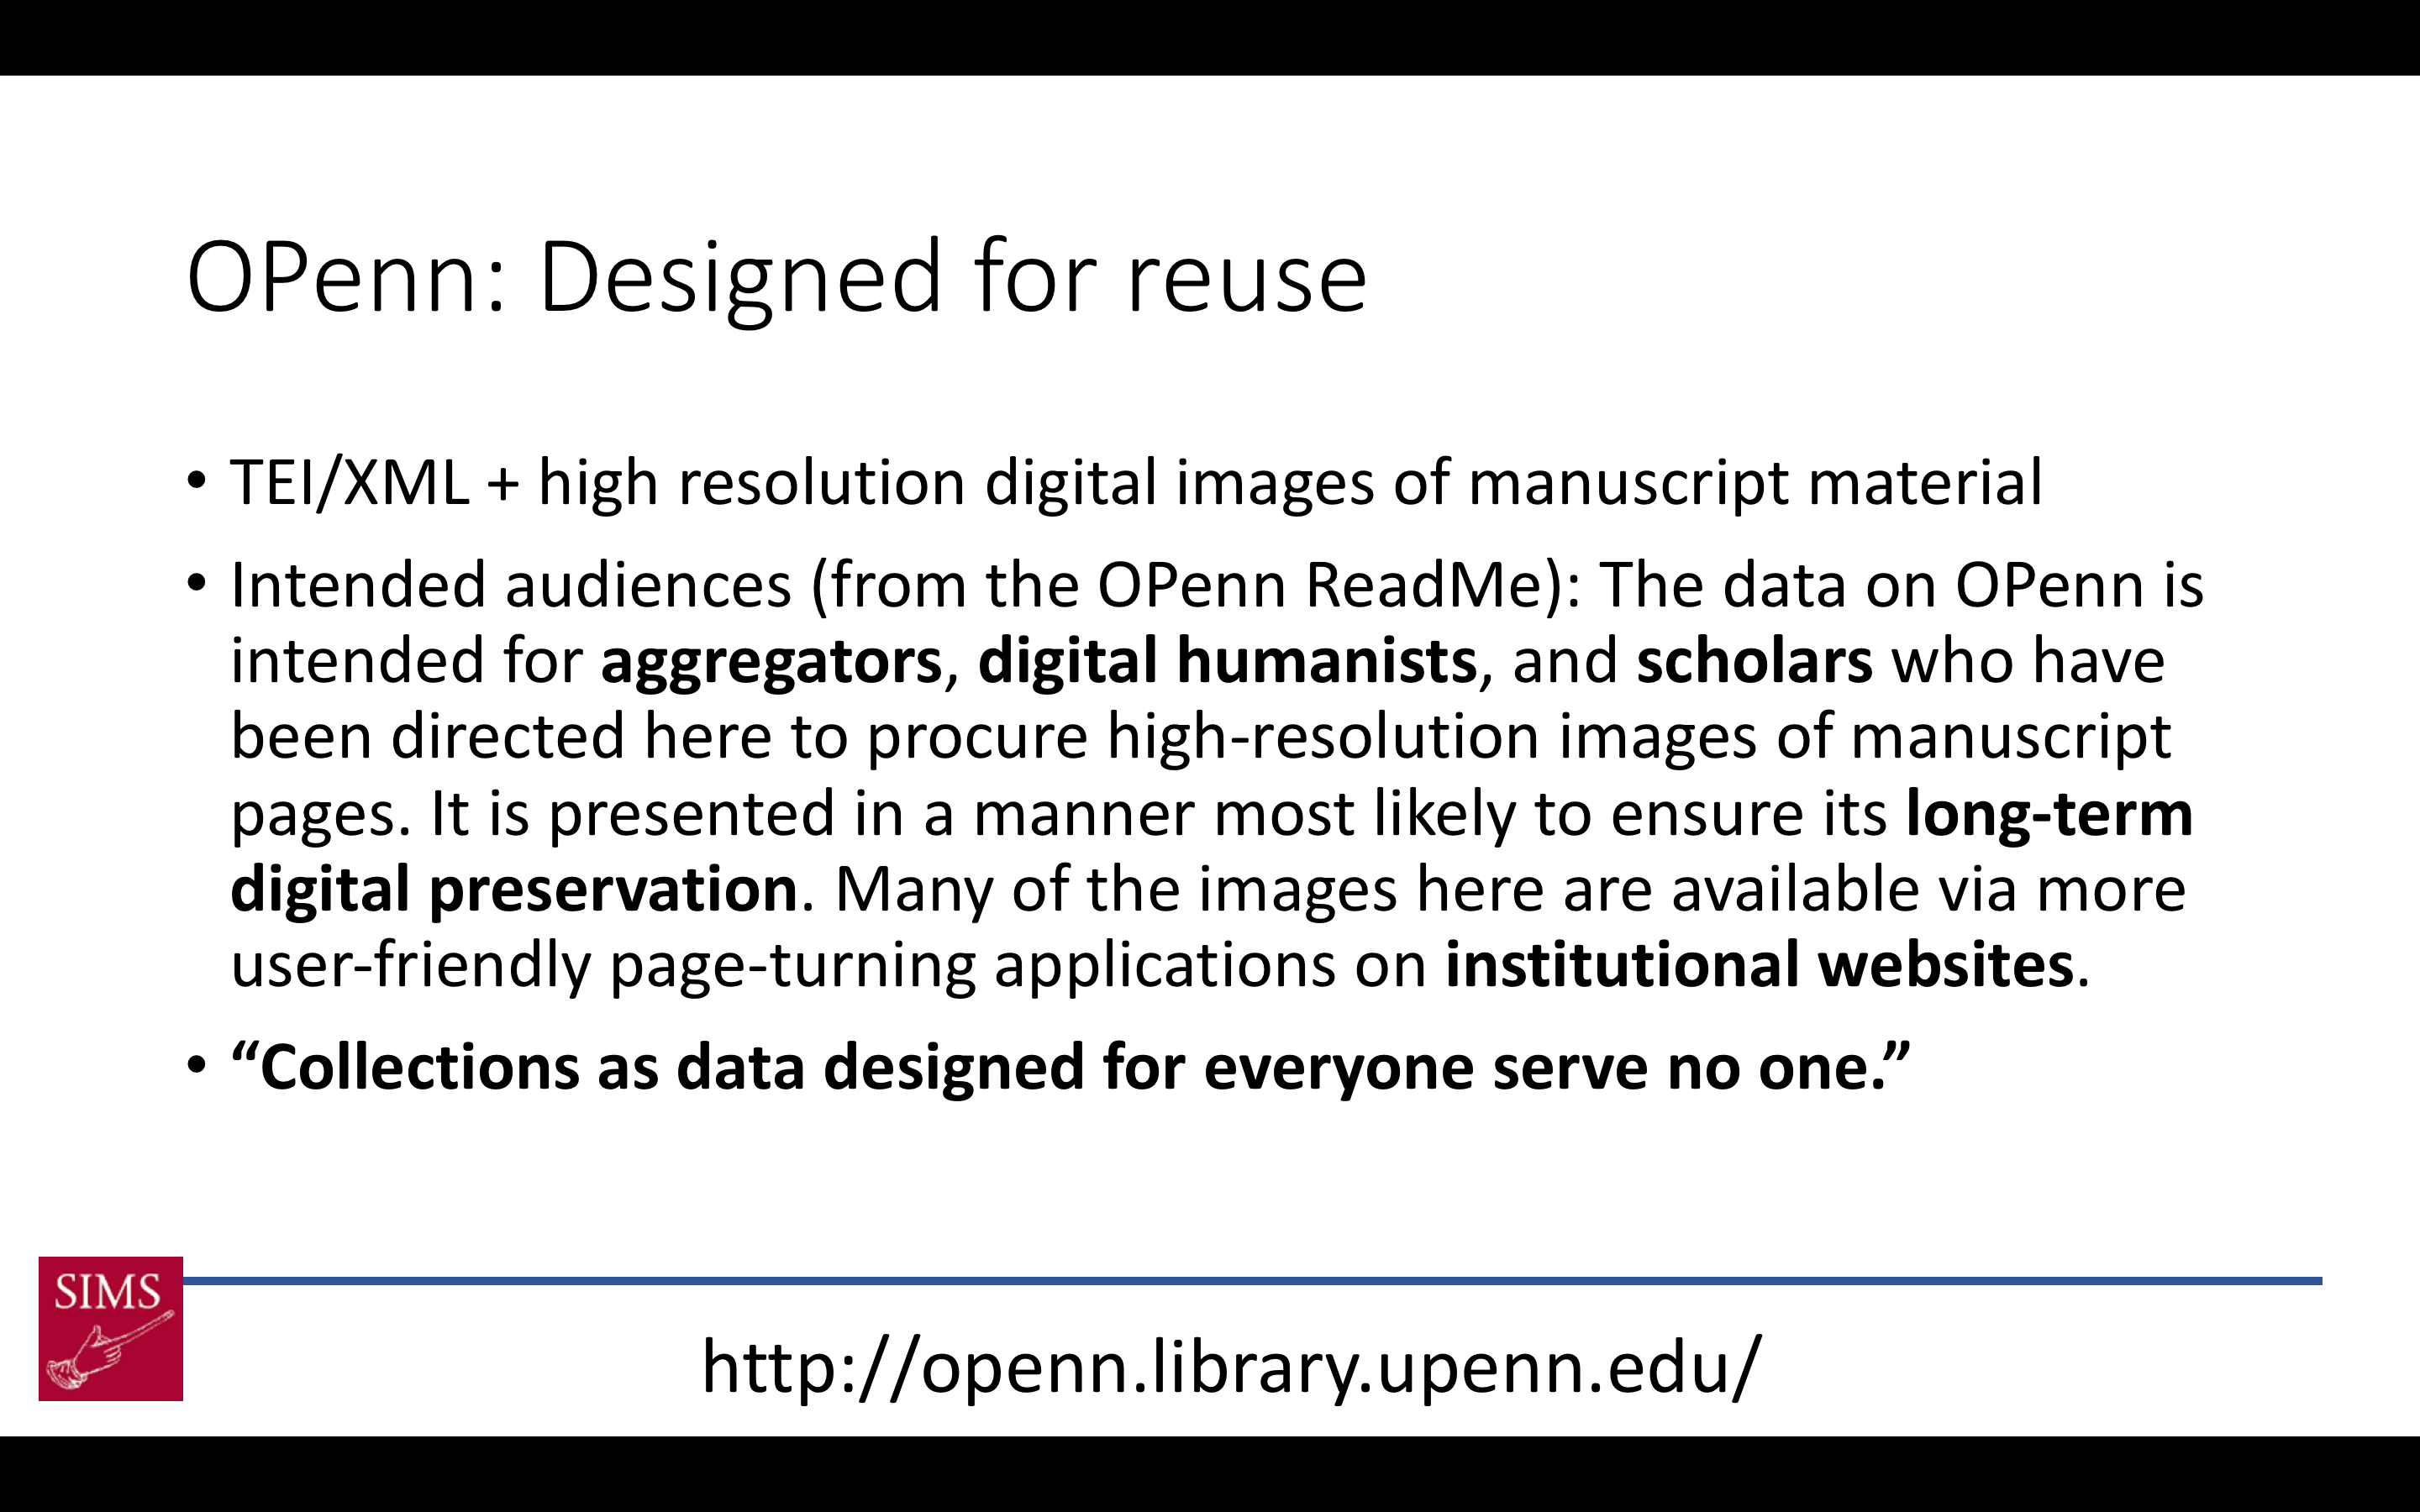
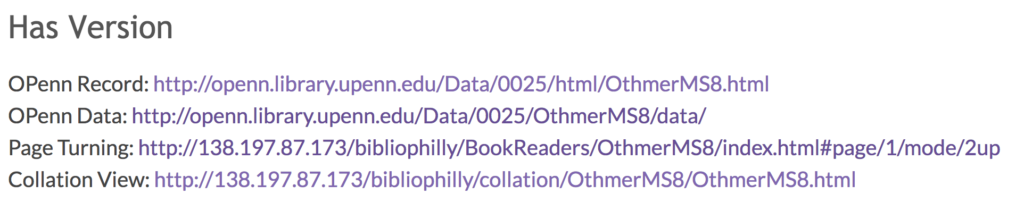
They go on OPenn: Primary Digital Resources Available for Everyone, which is a website where we make available raw data as Free Cultural Works. For BiblioPhilly, this means images, including high-resolution master TIFFs, in the Public Domain, and metadata in the form of TEI Manuscript Descriptions under CC:0 licenses – this means released into the public domain.
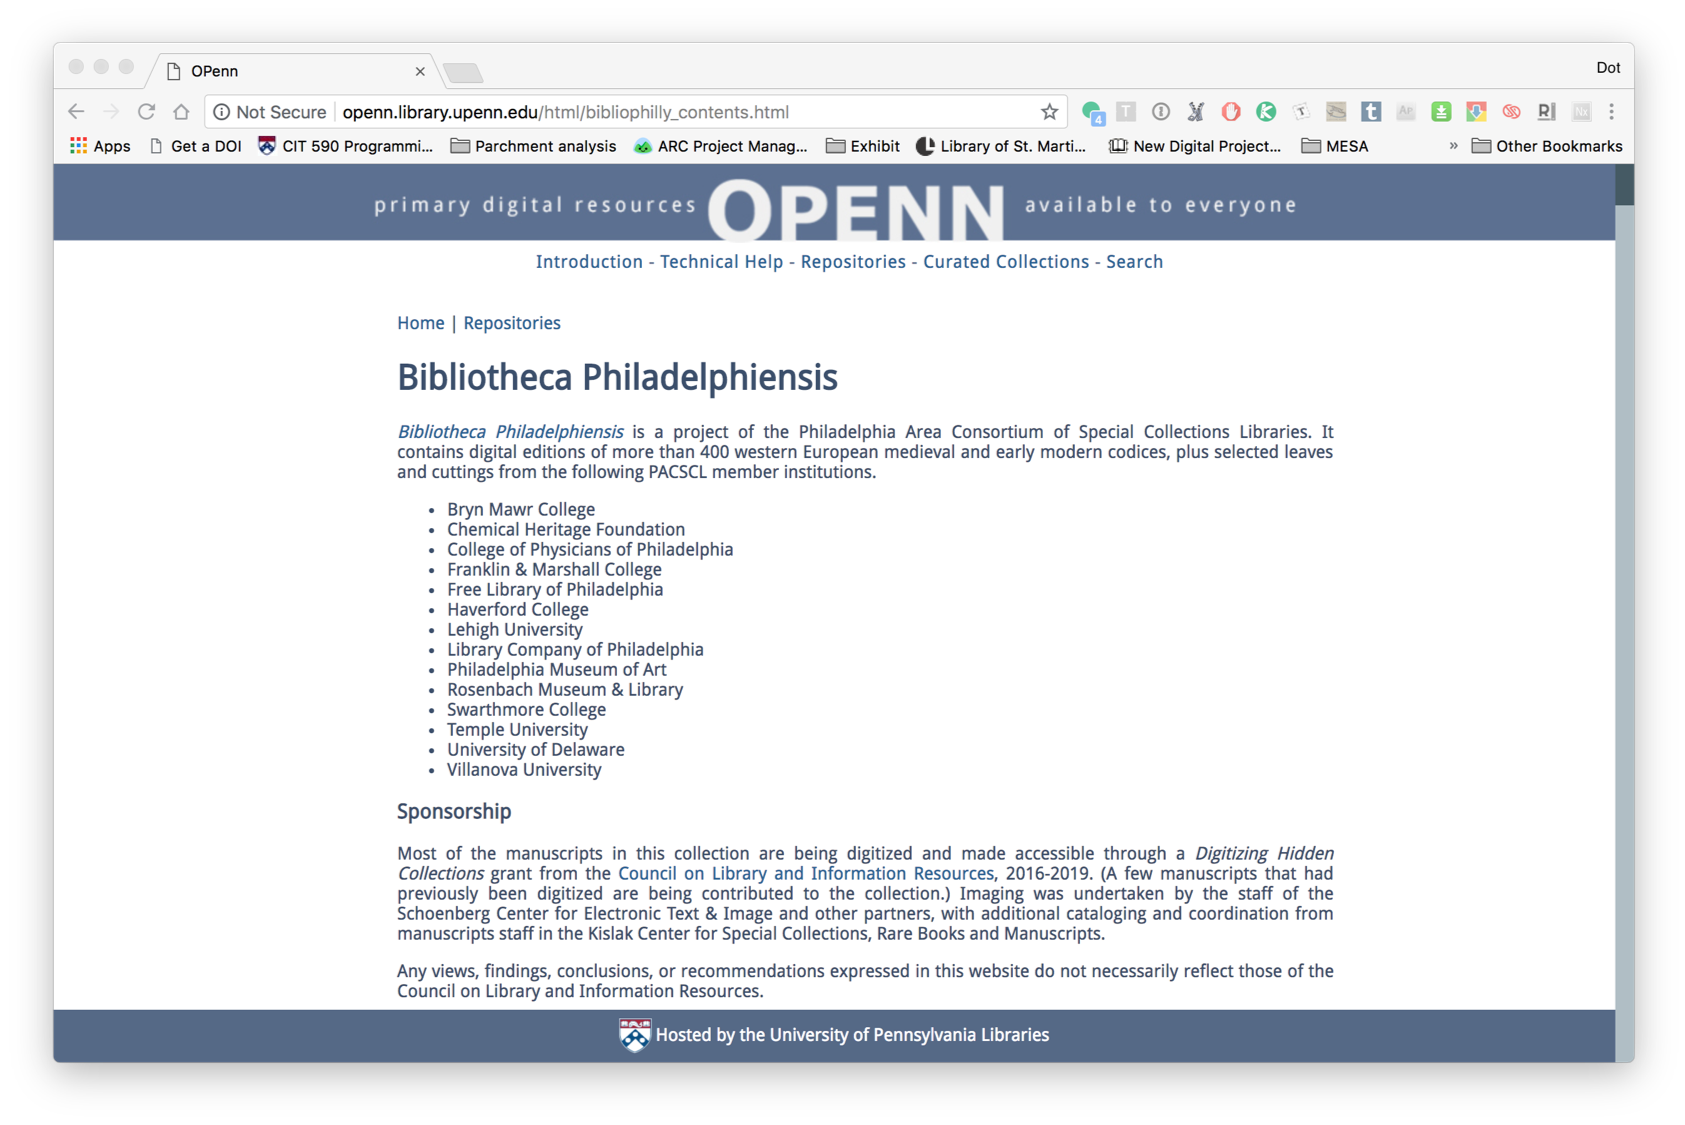
OPenn has a very specific purpose: it’s designed to make data available for reuse. It is not designed for searching and browsing. There is a Google search box, which helps, but not the kind of robust keyword-based browsing you’d expect for a collection like this.

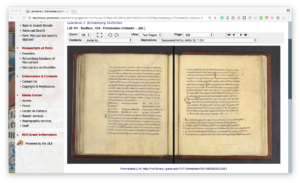
And the presentation of the data on the site is also simple – this is an HTML rendition of a TEI file, with the information presented very simply and image files linked at the bottom. There’s no page-turning facility or gallery or filmstrip-style presentation. And this is by design. We designed it this way, because we believe in separating out data from presentation. The data, once created, won’t change much. We’ll need to migrate to new hardware, and at some point we may need to convert the TEI to some other format. The technologies for presentation, on the other hand, are numerous and change frequently. So we made a conscious decision to keep our data raw, and create and use interfaces as they come along, and as we wish. Releasing the data as Free Cultural Works means that other people can create interfaces for our data as well, which we welcome.
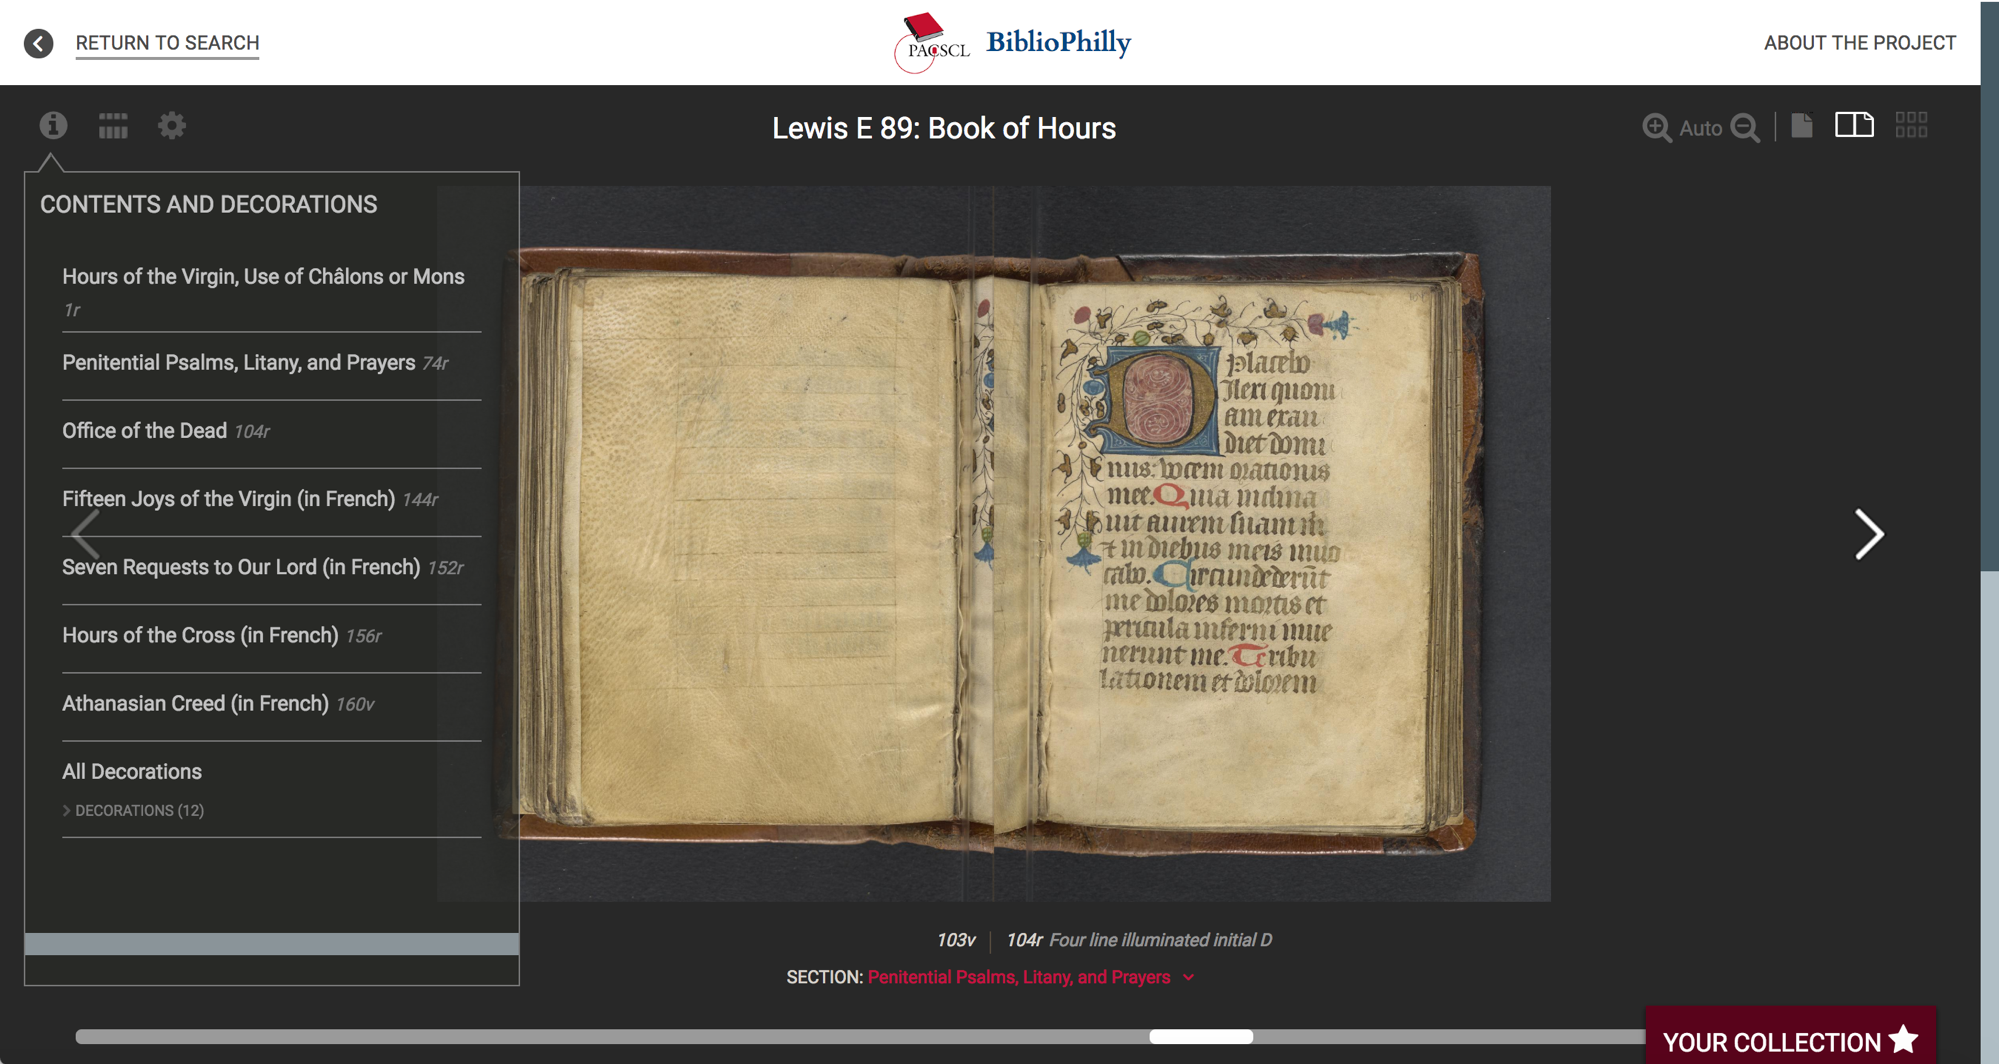
So we are working on an interface for the Bibliotheca Philadelphiensis data right now. We’re partnering with a development company that worked with the Walters Art Museum on their site called Ex Libris (manuscripts.thewalters.org), and this is the site that most people will use to interface with the collection. It has the browsing facility you’d expect.
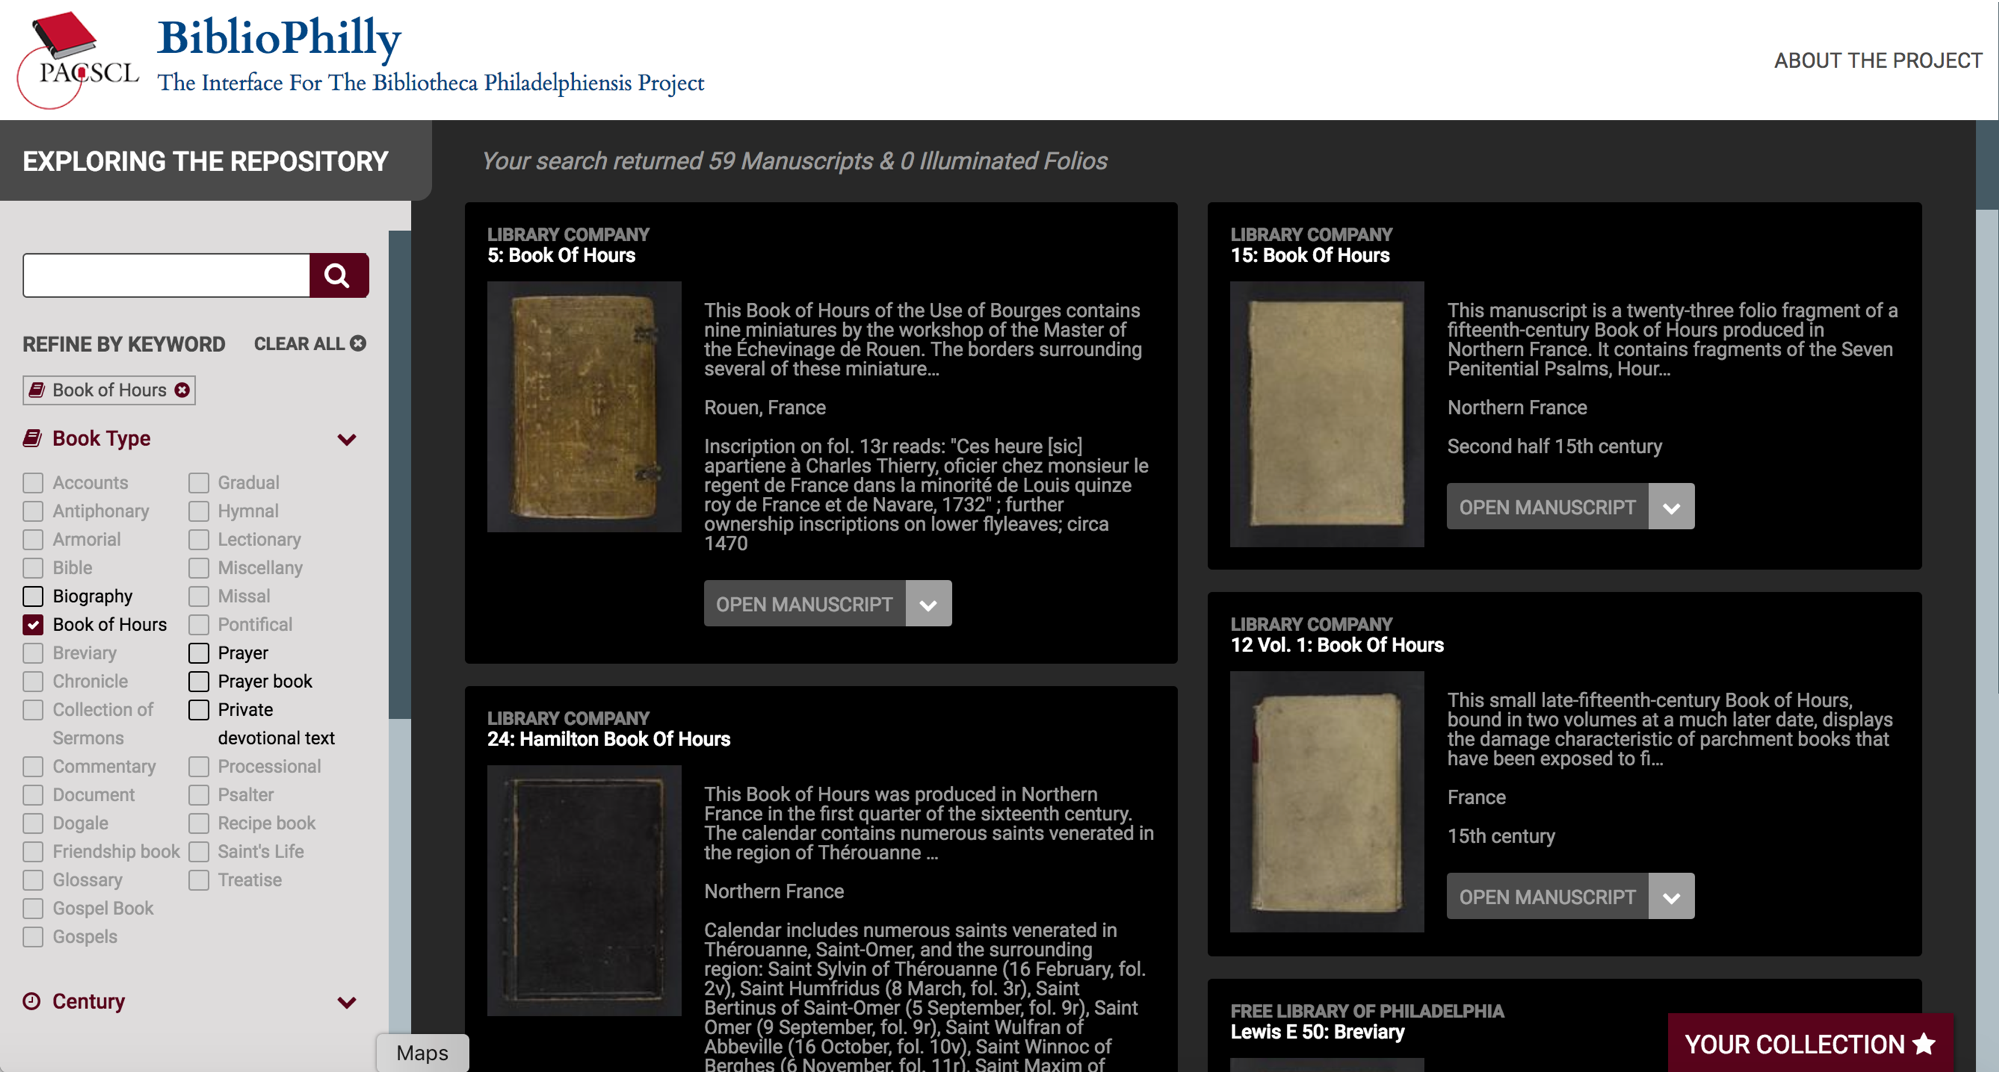
Here we’re selecting a Book of Hours.
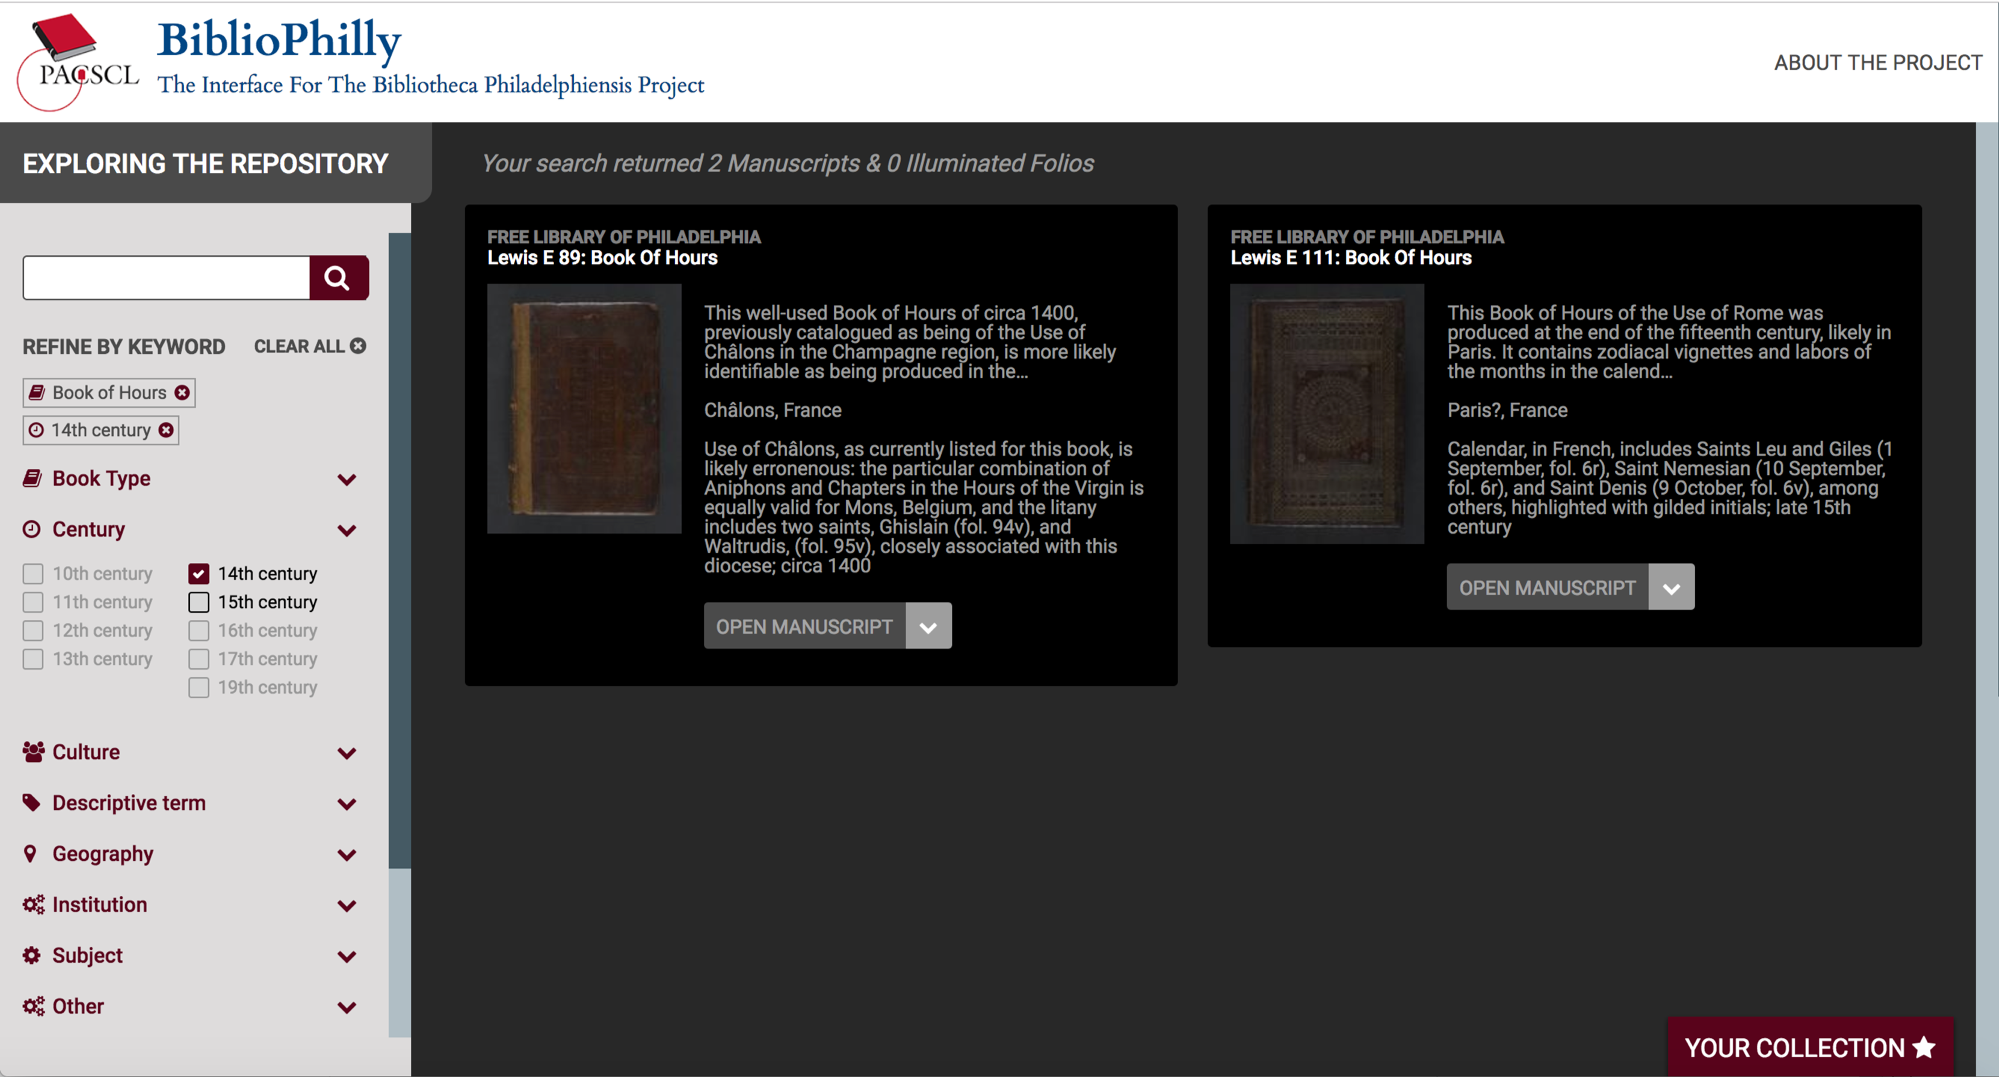
Let’s say we just want 14th century Books of Hours.
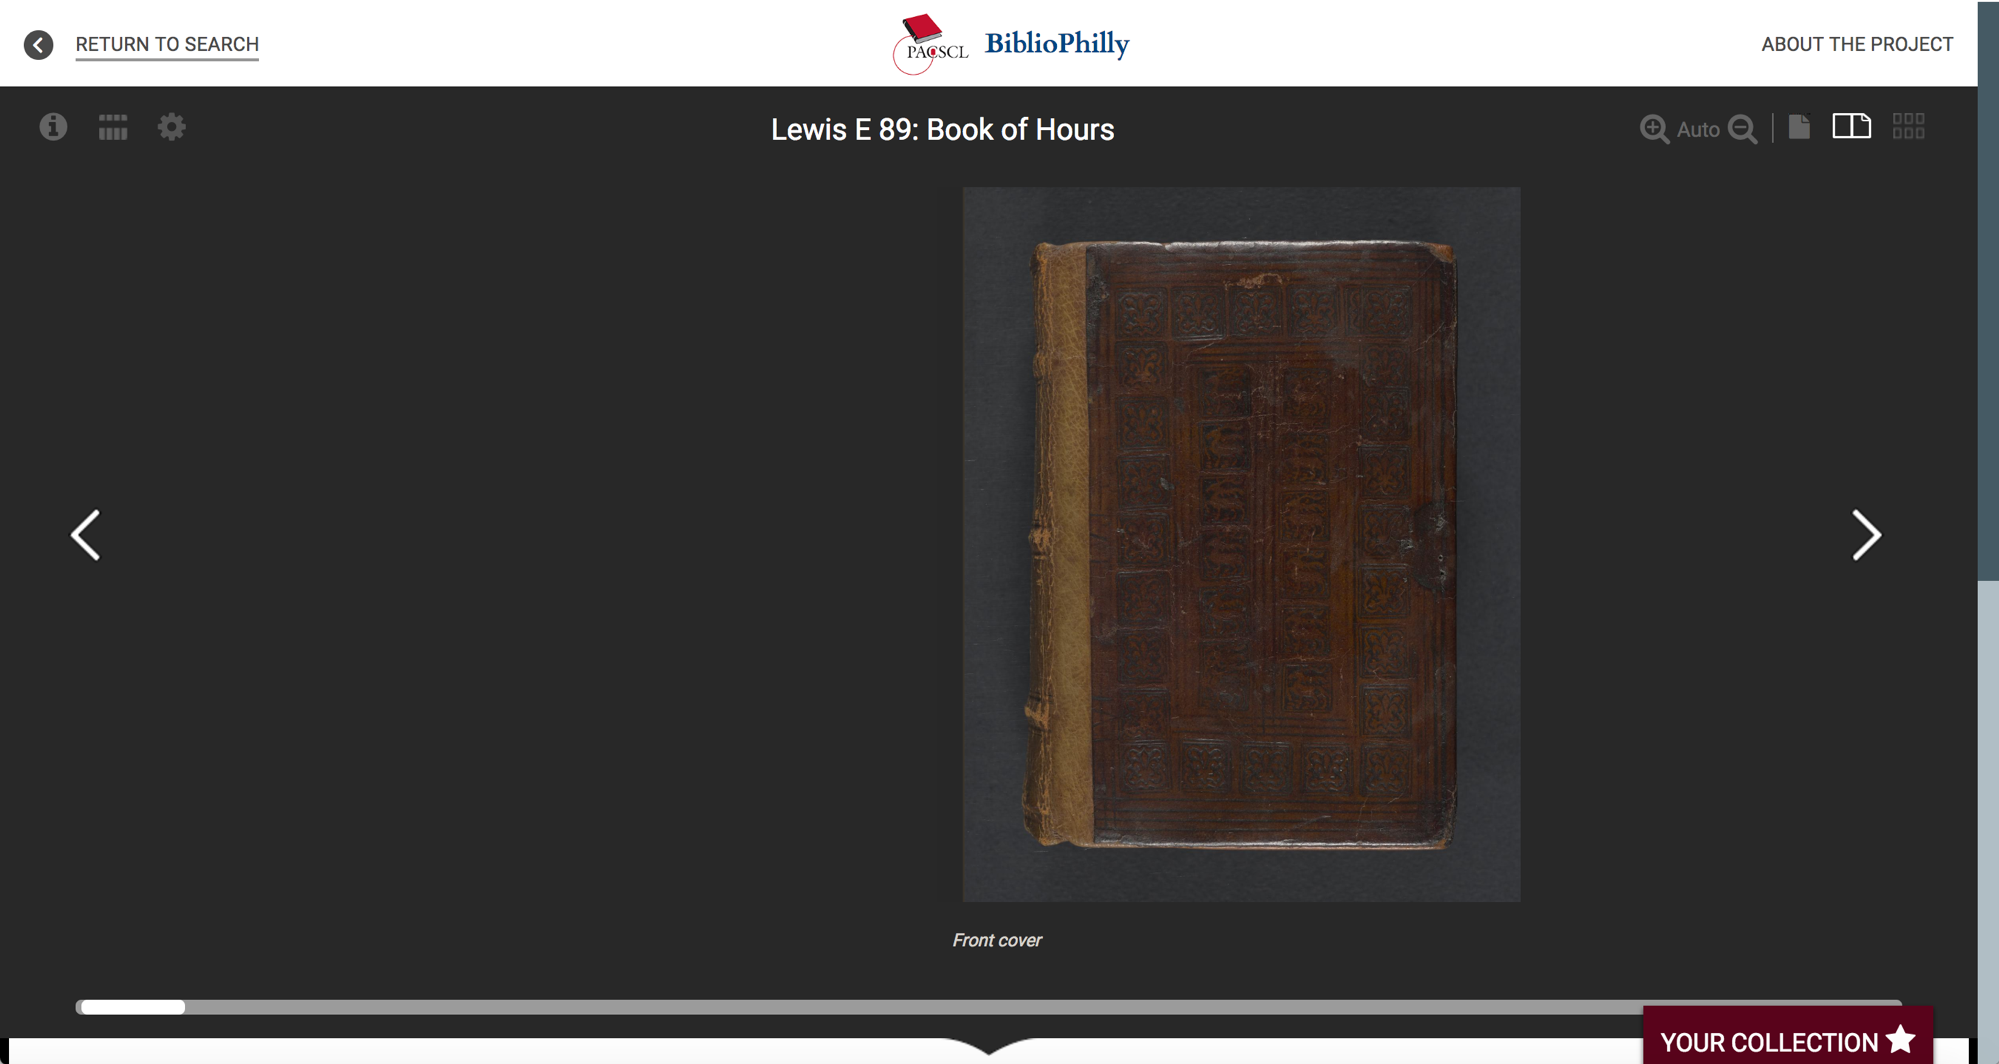
So here’s Lewis E 89,
we have a Contents and Decorations menu so we can browse directly to a specific text, here’s the start of the Office of the Dead with a four-line illuminated initial.
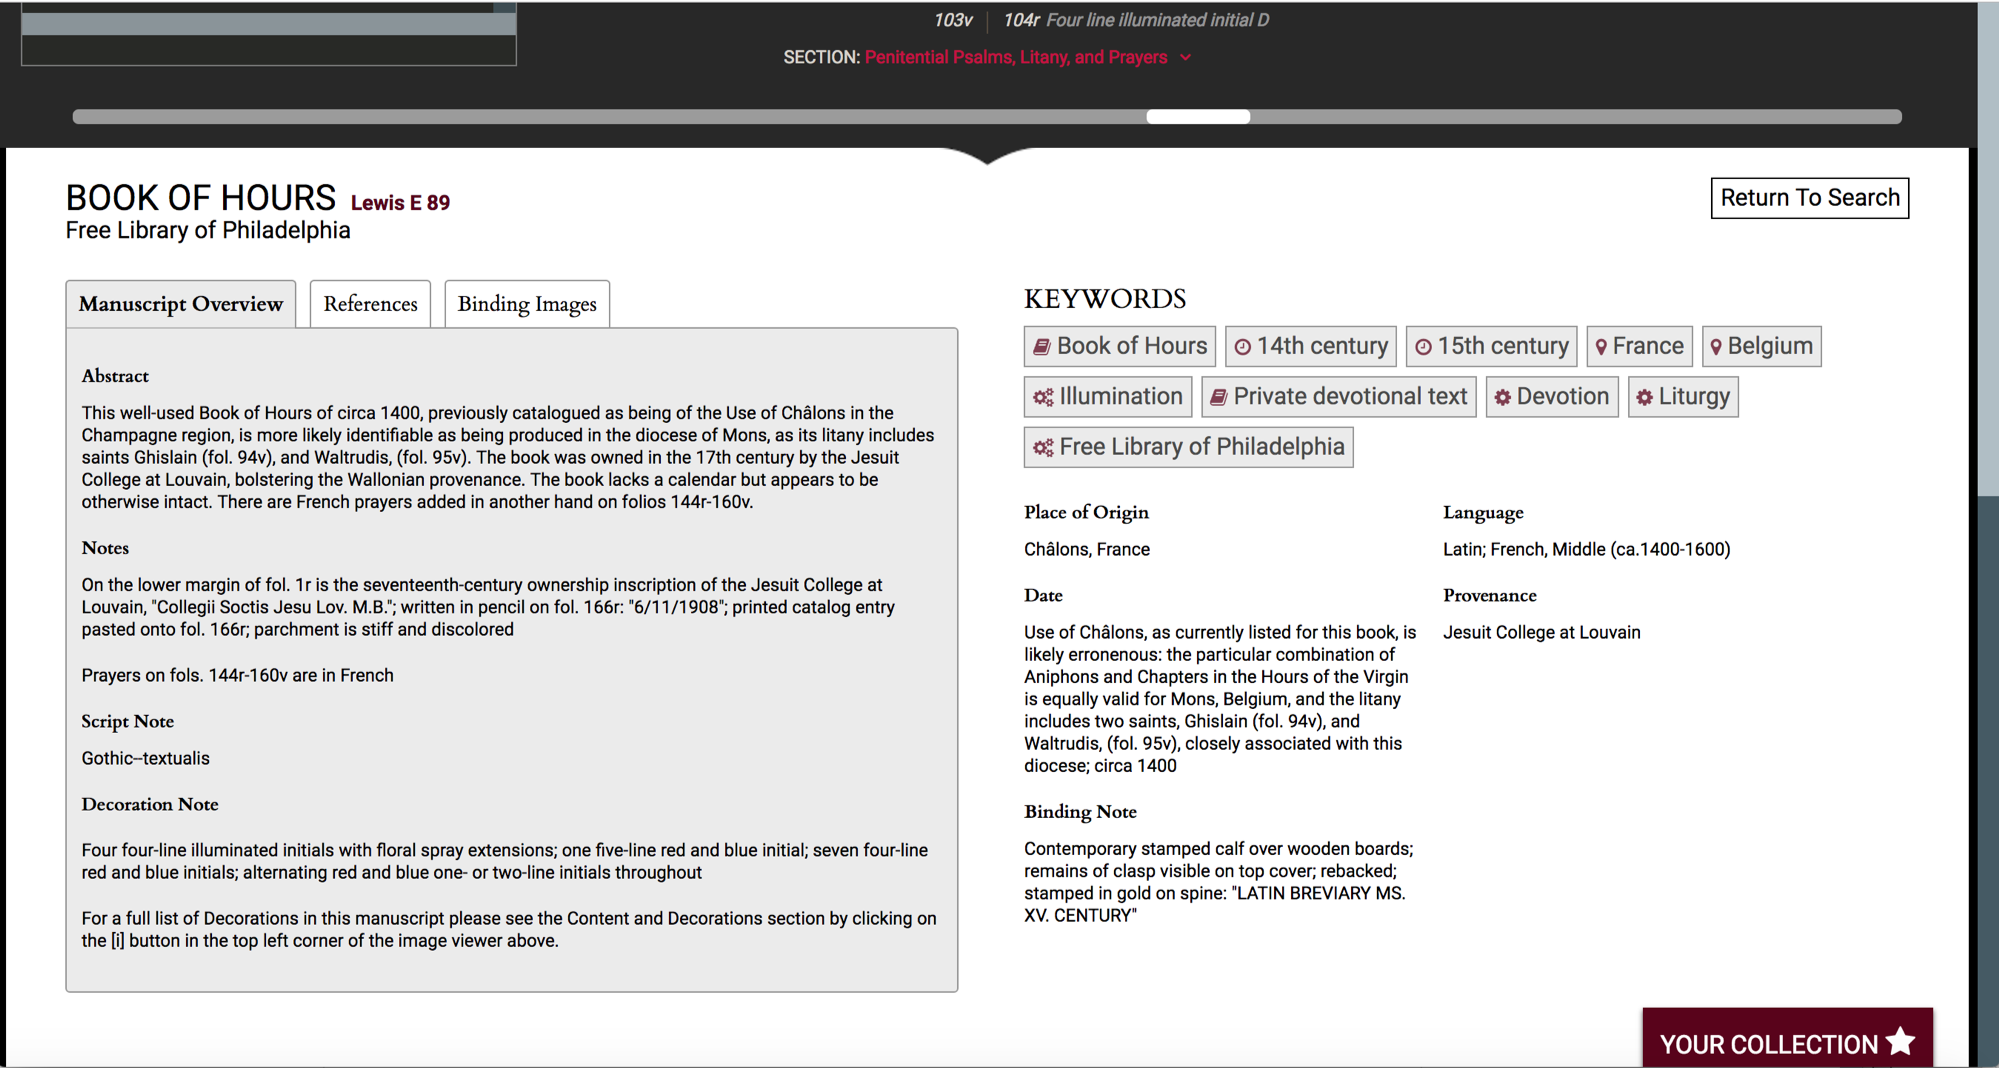
And then further down the page is all the data from the record you’d expect to see on any good digitized manuscript site. This is pulled from the TEI Manuscript Descriptions and indexed in a backend database for the site, while the images are pulled directly from their URLs on OPenn.
So this is great. We’re doing very important work making data about manuscripts available to the world, in ways that make it easy to reuse them, whether to build new projects or to just publish an image in a book or on a website. And I want to make it clear that I don’t intend anything in the rest of my talk to undermine this vital work. But. but.
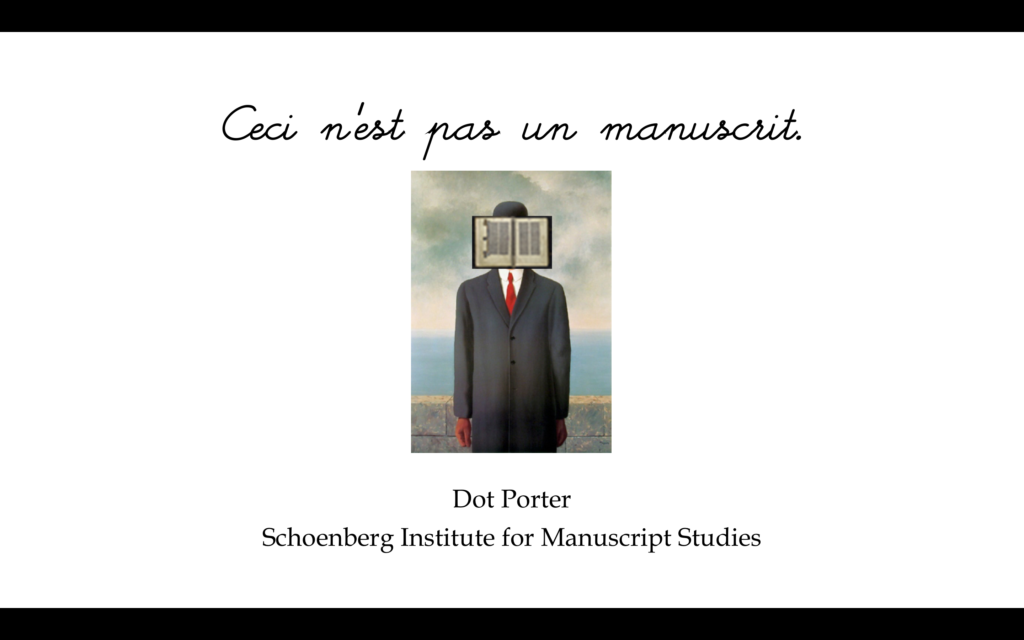
I mentioned that I’m also the resident Digital Humanist on our team. And in addition to the technical work involved in that, the work of building tools (which I promise I will get to before this talk is finished) I do a lot of thinking about what it is we do. And there’s a question, one question that keeps me up at nights and drives the focus of my current research. The question comes out of a statement. And that statement is:
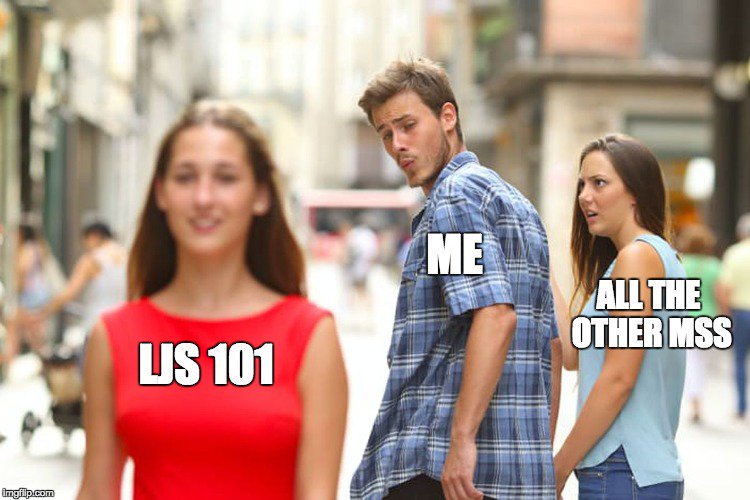
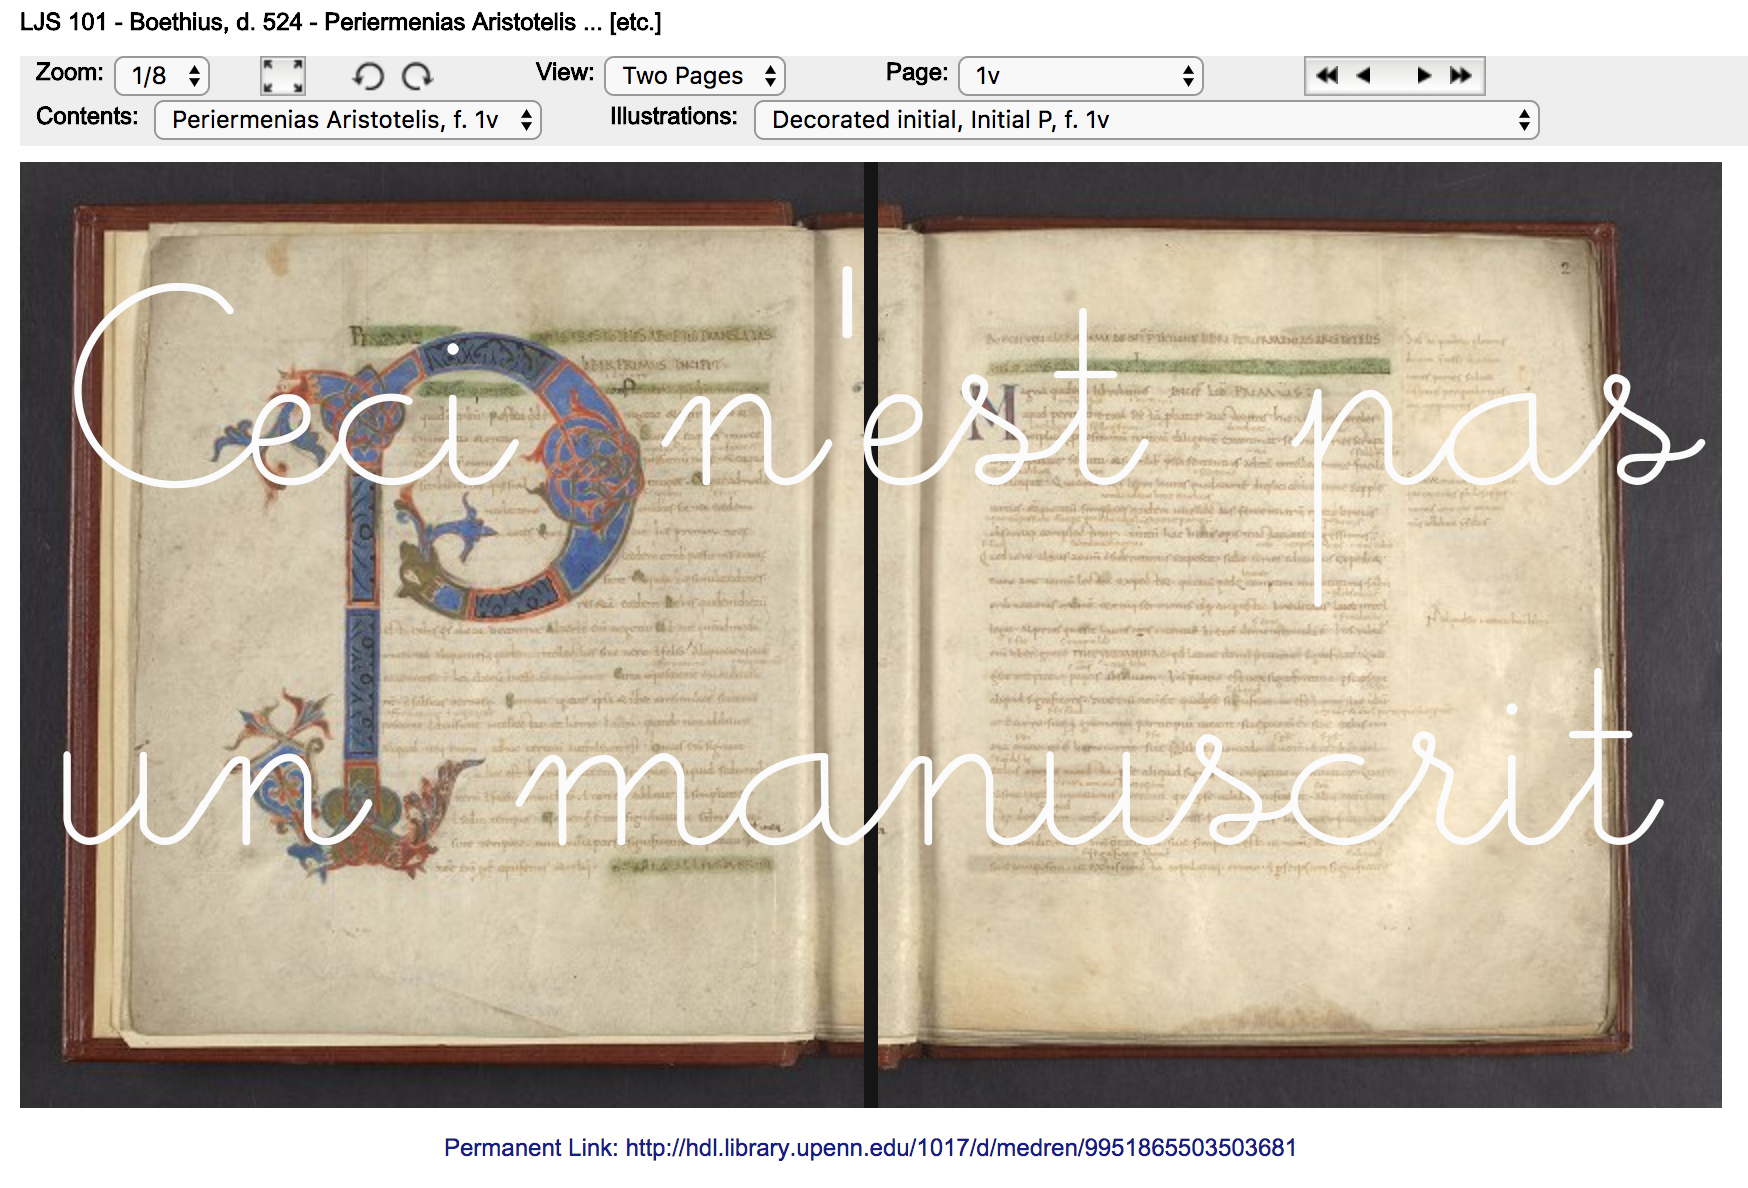
The digitized manuscript is not the manuscript itself.
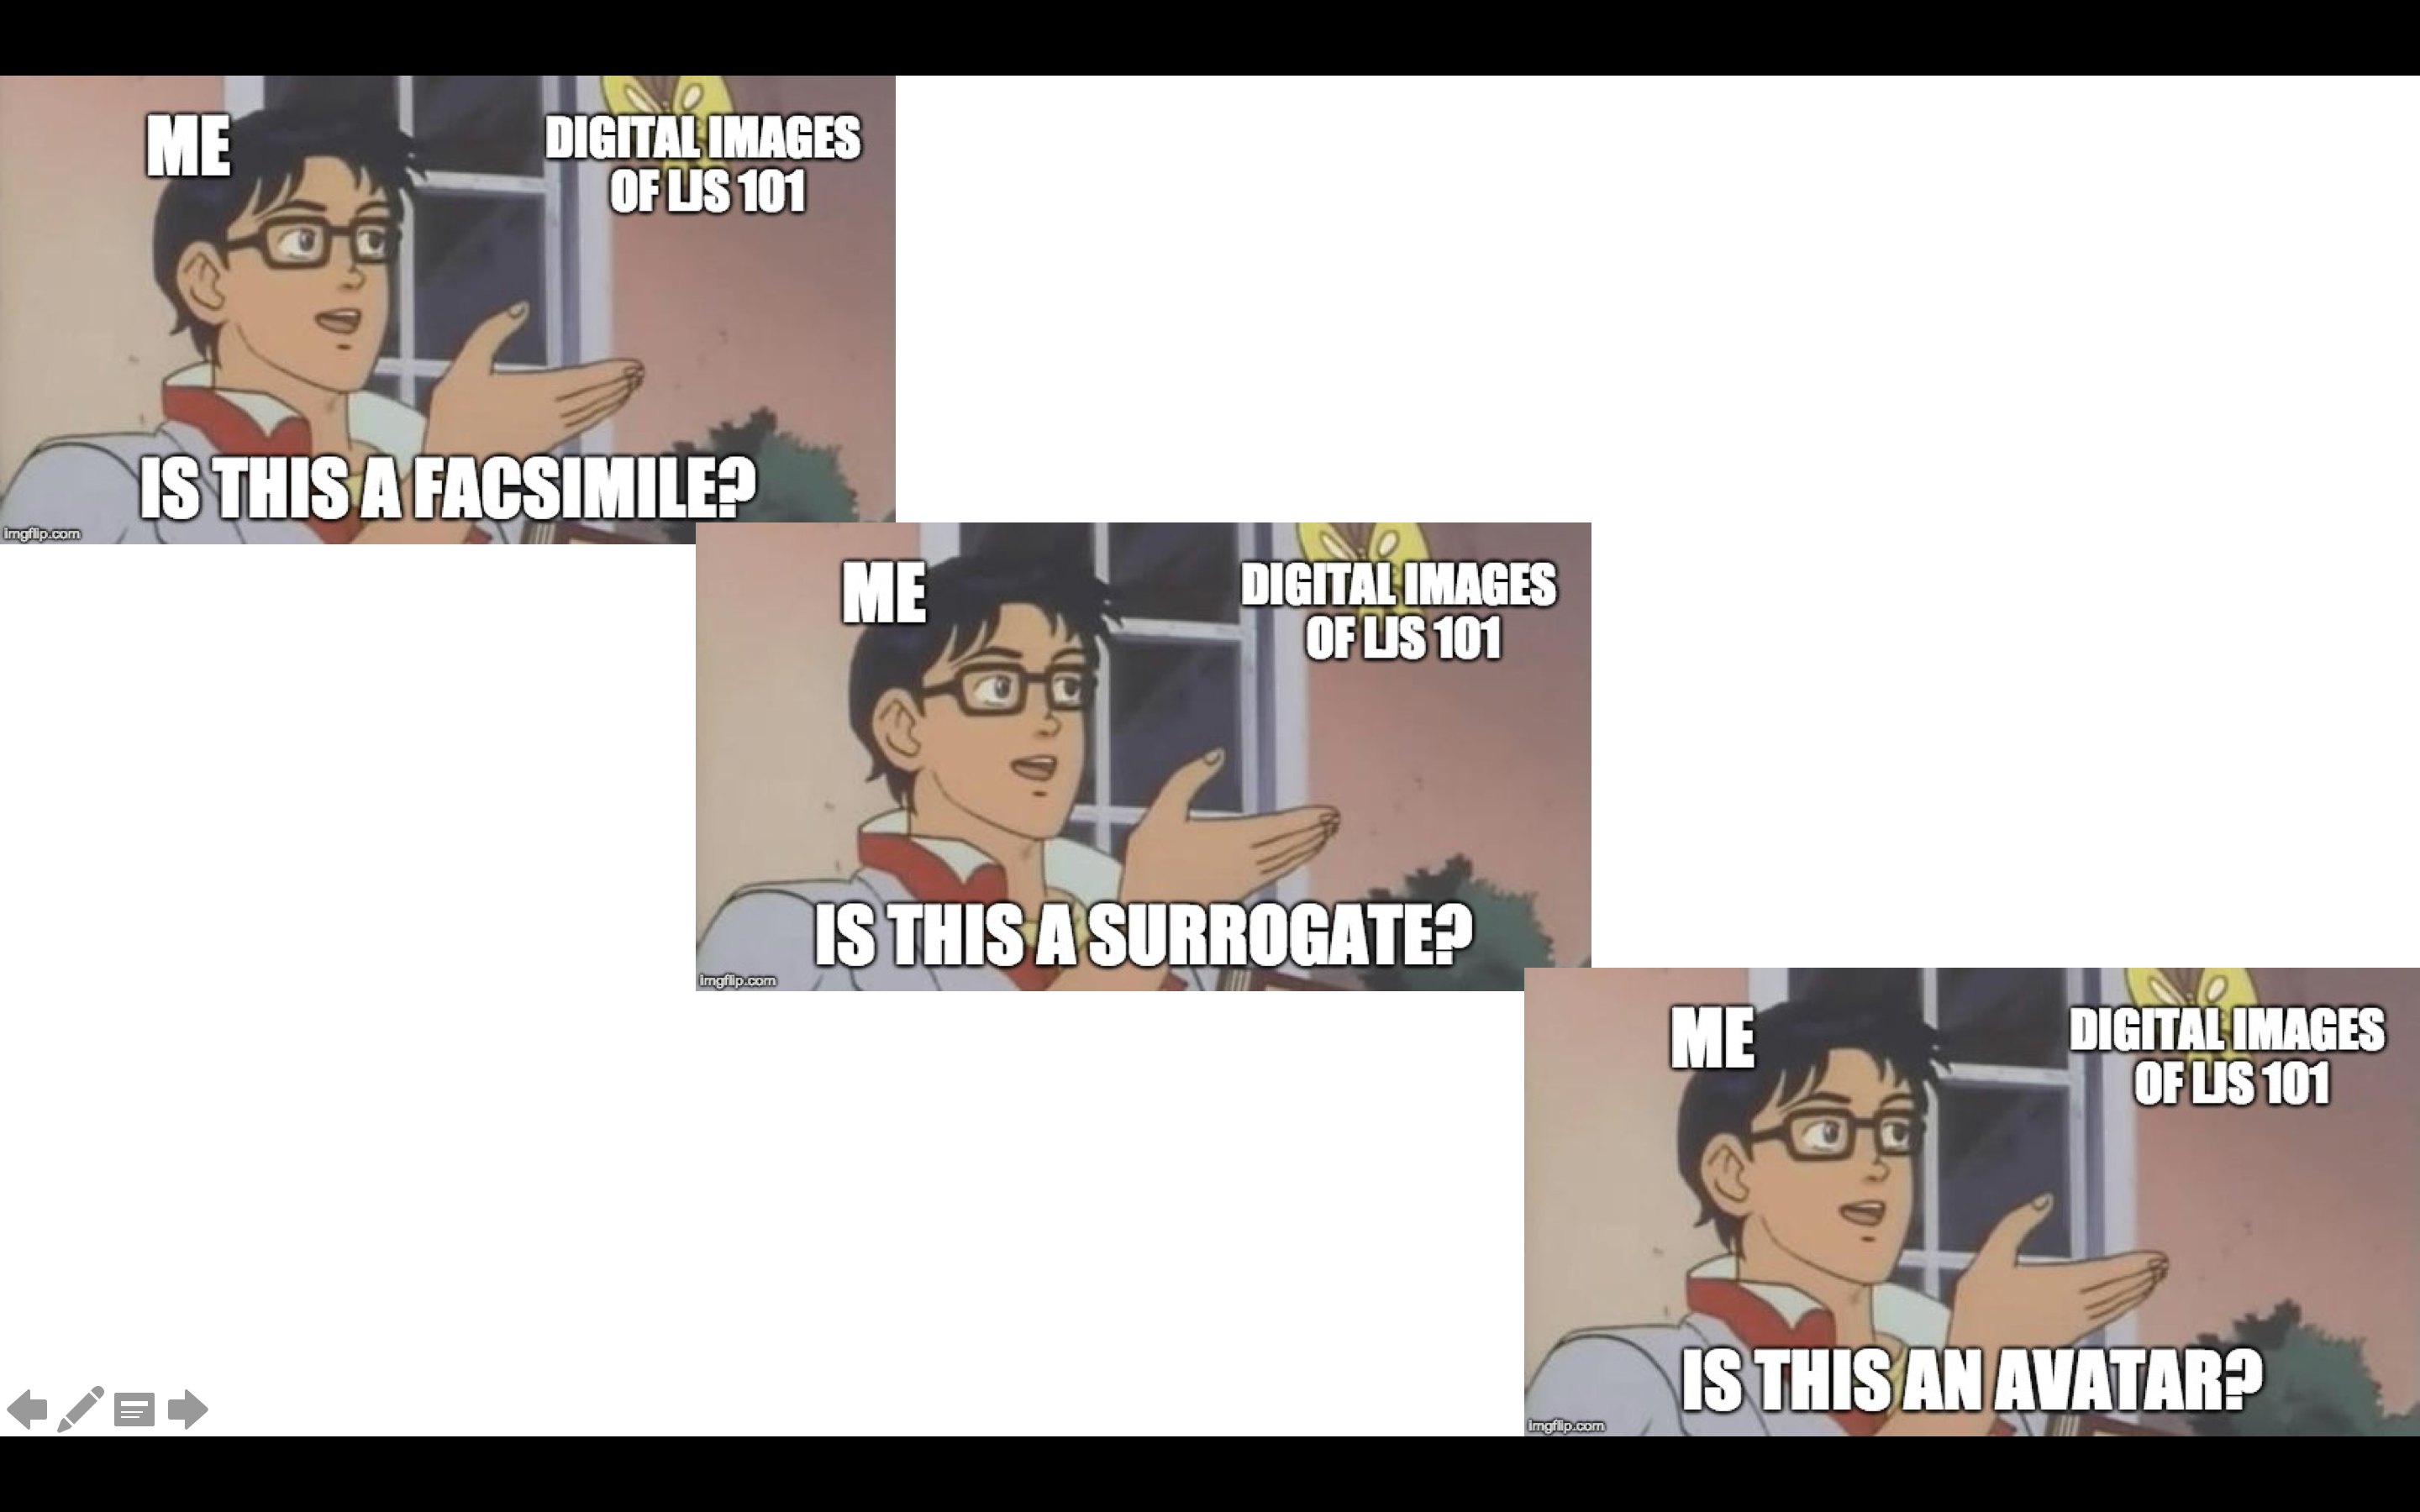
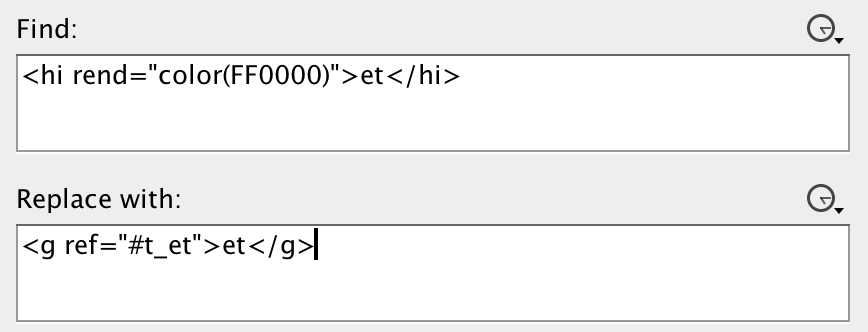
Or, as I prefer it, in meme form
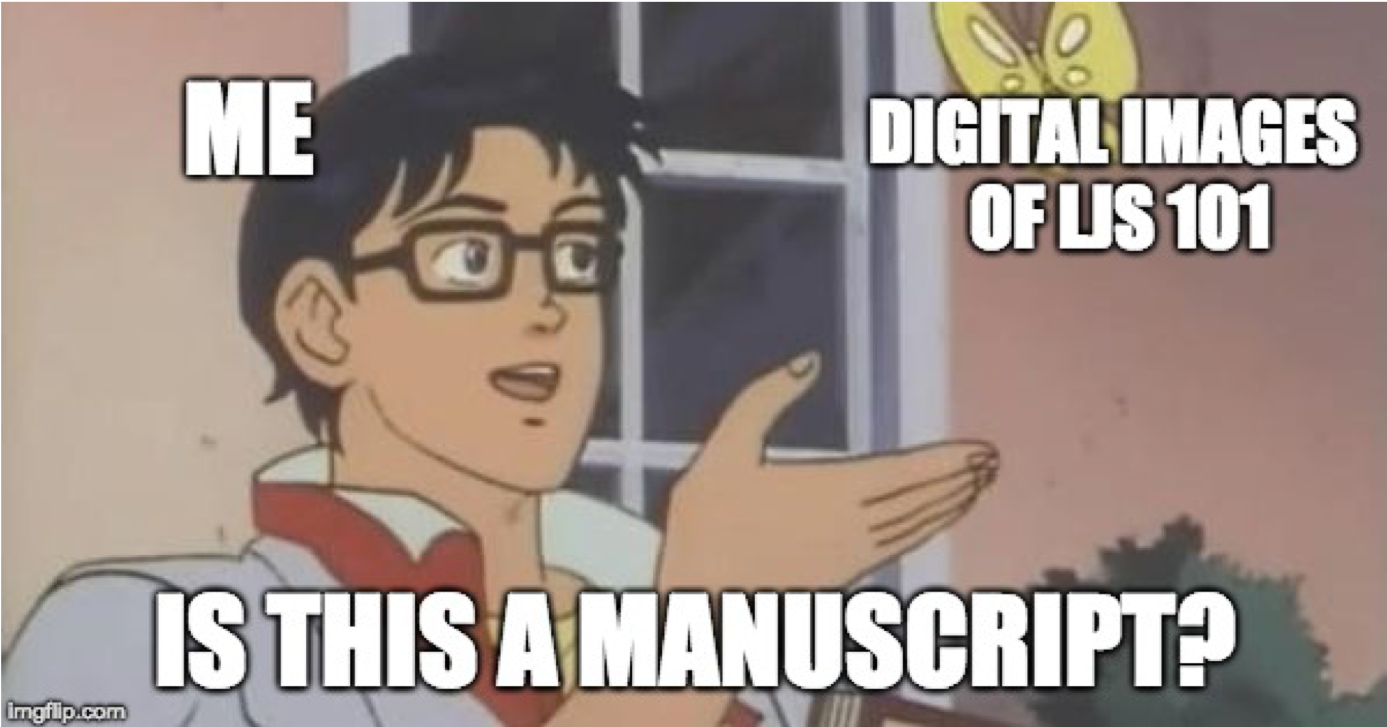
This shouldn’t be a controversial statement, to anyone who has ever worked with a manuscript and then used a digital version of it. It’s obvious. This is an obvious statement. And yet we undermine this statement all the time in the ways we talk about digitized manuscripts – I do it to. How many times have you said, or heard someone else say, “I saw the manuscript online” or “I consulted it online” or “I used it online”? Not pictures of the manuscript or the digitized manuscript but the manuscript? So one question to come out of this is:
If the digitized manuscript isn’t the manuscript, then what is it?
This is not actually the question that keeps me up nights, because although this is interesting, it’s not practical or useful for me. My job is to make these things available so you can use them. So the question that actually keeps me up at night is:
If a digitized manuscript isn’t a manuscript, how can we present it in ways that explore aspects of the original’s manuscript-ness, ethically and with care, while both pushing and respecting the boundaries of technology? Although this practice of thinking about what it means to digitize a manuscript and what that becomes seems really philosophical, this is really practical question.
As a librarian who works on the digitization and online presentation of medieval manuscripts, I think it’s really important for me and others in my position to be mindful about what exactly it is that we do in our work.
So for the rest of our time today I’ll first go over a few things I’ve already worked out a bit for other papers, and then move on to the Ghost in the Machine, which is new and confuses me in a way that my previous stuff hasn’t.
Outline (my work so far):
- Uncanny valley
- Memes & Terms
- Transformative works
- Ghost in the Machine*
The Uncanny Valley
We’ll start with the Uncanny Valley, which I presented on at the International Congress on Medieval Studies in Kalamazoo this May although I have been thinking about applying the uncanny valley to digitized manuscripts since 2008.
The uncanny valley is a concept that comes out of robotics and it has to do with how humans perceive robots as they become more like humans. The concept was first described by Masahiro Mori in a 1970 article in the Japanese journal Energy, and it wasn’t translated into English completely until 2012. In this article, Mori discusses how he envisions people responding to robots as they become more like humans. The article is a thought piece – that is, it’s not based on any data or study. In the article, Mori posits a graph, with human likeness on the x axis and affinity on the y axis. Mori’s proposition is that, as robots become more human-like, we have greater affinity for them, until they reach a point at which the likeness becomes creepy, or uncanny, leading to a sudden dip into negative affinity – the uncanny valley.
First, Robots are physical objects that resemble humans more or less (that is the x-axis of the graph)
Second, as robots become more human-like, people have greater affinity for them (until they don’t – uncanny valley) – this is the y-axis of the graph
Third, the peak of the graph is a human, not the most human robot
Fourth, the graph refers to robots and to humans generally, not robots compared to a specific human
And the four parallel points:
First, digitized manuscripts are data about manuscripts (digital images + structural metadata + additional data) that are presented on computers through interfaces. Digitized manuscripts are fragments, and in visualizing the manuscript on a computer we are reconstructing them in various ways. These presentations resemble the parent manuscript more or less (this is the x-axis)
Second, as presentations of digitized manuscripts become more manuscript-like, people have greater affinity for them (until they don’t – uncanny valley) – this is the y-axis
Third, the peak of the graph is the parent manuscript, not the most manuscript-like digital presentation
Fourth, the graph refers to a specific manuscript, not to manuscripts generally
I think that this is the major difference in applying the concept of the uncanny valley to manuscripts vs. robots: while Robots are general, not specific (i.e., they are designed and built to imitate humans and not specific people), the ideal (i.e., most manuscript-like) digital presentation of a manuscript would need to be specific, not general (i.e., it would need to be designed to look and act like the parent manuscript, not like any old manuscript)
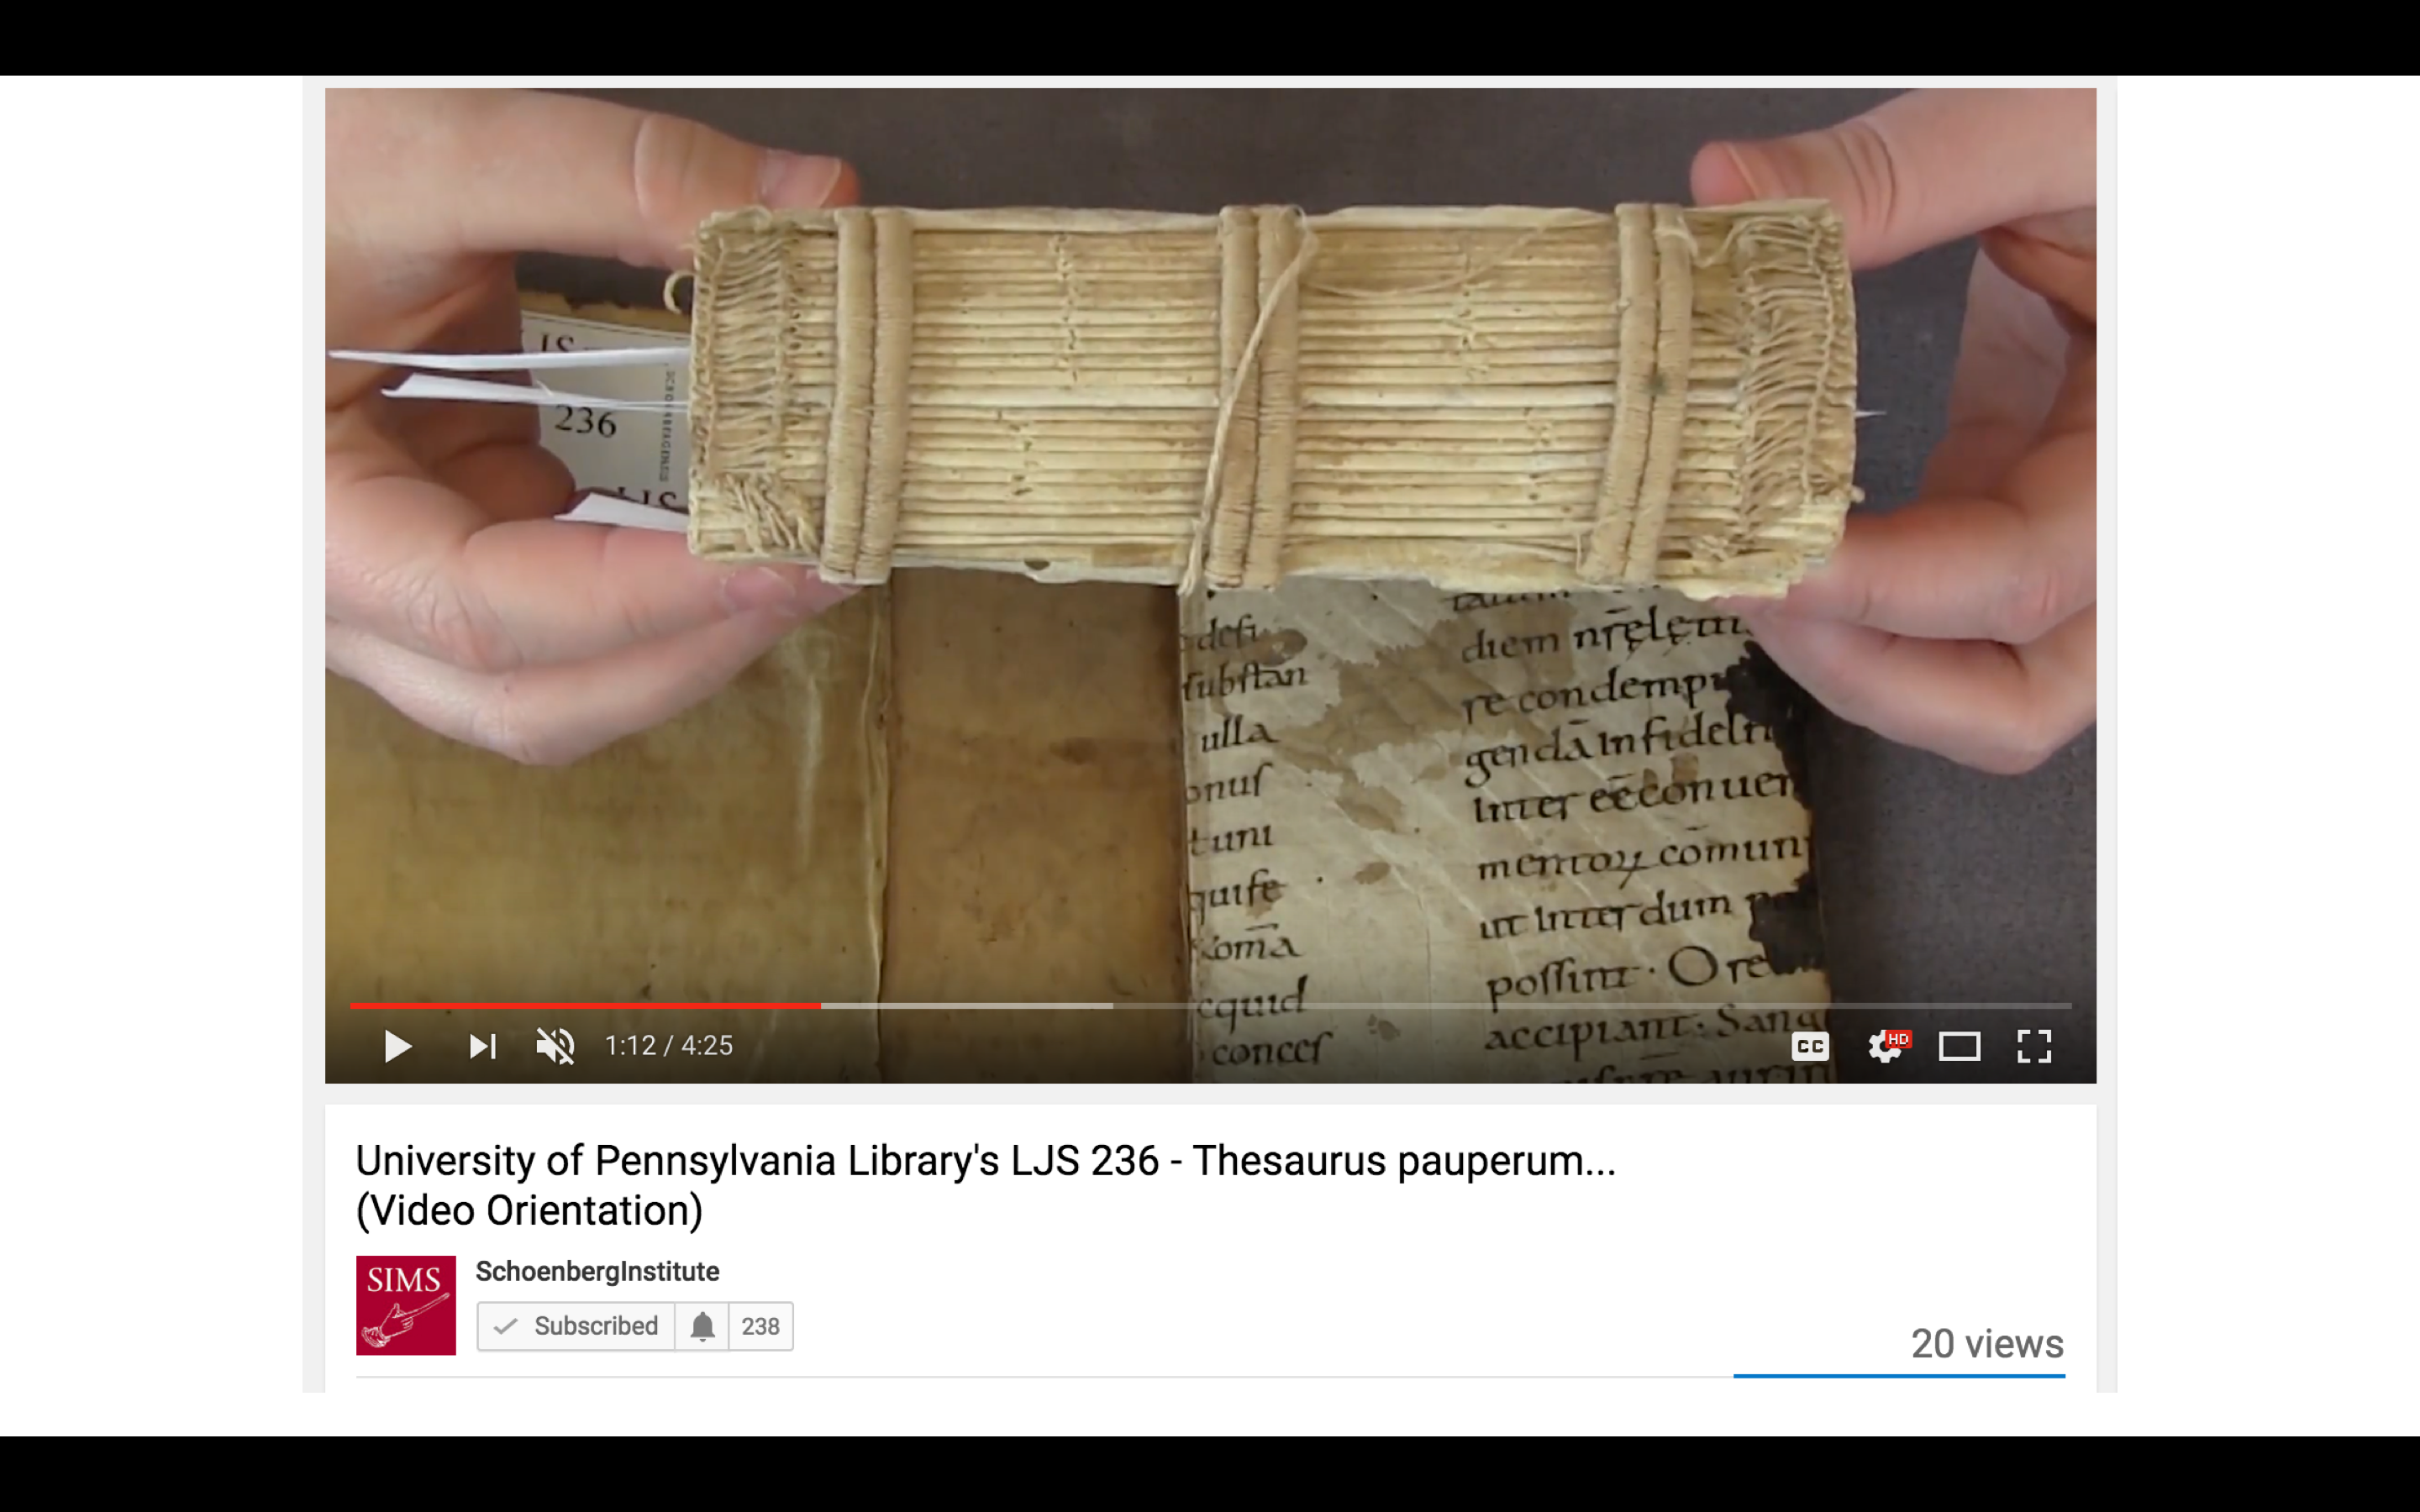
The Effect of Movement is an important piece of the functioning of the uncanny valley for robotics, and it is also important when thinking about manuscripts. Manuscripts, after all, are complex physical objects, much as humans are complex physical objects. Manuscripts have multiple leaves, which are connected to each other across quires, the quires which are then bound together and, often, connected to a binding. So moving a page doesn’t just move that page, much as bending your leg doesn’t just move your leg. Turning the leaf of a manuscript might tug on the conjoined leaf, push against the binding, pull on the leaves preceding and following – a single movement provoking a tiny chain reaction through the object, and one which, with practice, we are conditioned to recognize and expect. If things move other than we expect them to (as zombies move differently from humans in monster movies) our brains will recognize that there is something “off” about them
Here is a video of me turning the pages of Ms. Codex 1056, a Book of Hours from the University of Pennsylvania. This will give you an idea of what this manuscript is like (its size, what its pages look like, how it moves, how it sounds). It’s a copy of the manuscript, showing just a few pages, and the video was taken in a specific time and space with a specific person. If you came to our reading room and paged through this manuscript, it would not look and act the same for you.
Now let’s take a look at this manuscript presented through Penn’s page turning interface, Penn in Hand (this is the University of Pennsylvania’s official interface and is separate from the BiblioPhilly interface that is under development) When you select the next page, the opening is simply replaced with the next opening (after a few seconds for loading). The images are, literally, flat. This is two images, taken at different times (perhaps within hours of each other), presented side-by-side to give the impression of a book opening. It’s a reconstruction using the digitized fragments.
These are two very different ways for looking at this manuscript through a digital interface, and they do very different things, illustrate different aspects of the book, and can be used in different ways. We’ll come back to this later in the talk, but for now I would like to move on to memes and terms.
Memes and Terms
I find the Uncanny Valley useful for providing a framework for presentation technologies along a spectrum from “less like the manuscript” to “more like the manuscript”. Next, I want to say a little bit about the terms that people choose to use to refer to digitized manuscripts, how we talk about them. (Initially presented this summer in a lecture for Rare Book School) I think that in this instance, terms function rather like memes, so I want to start with the meme (You’ll notice that I’m a fan of memes).
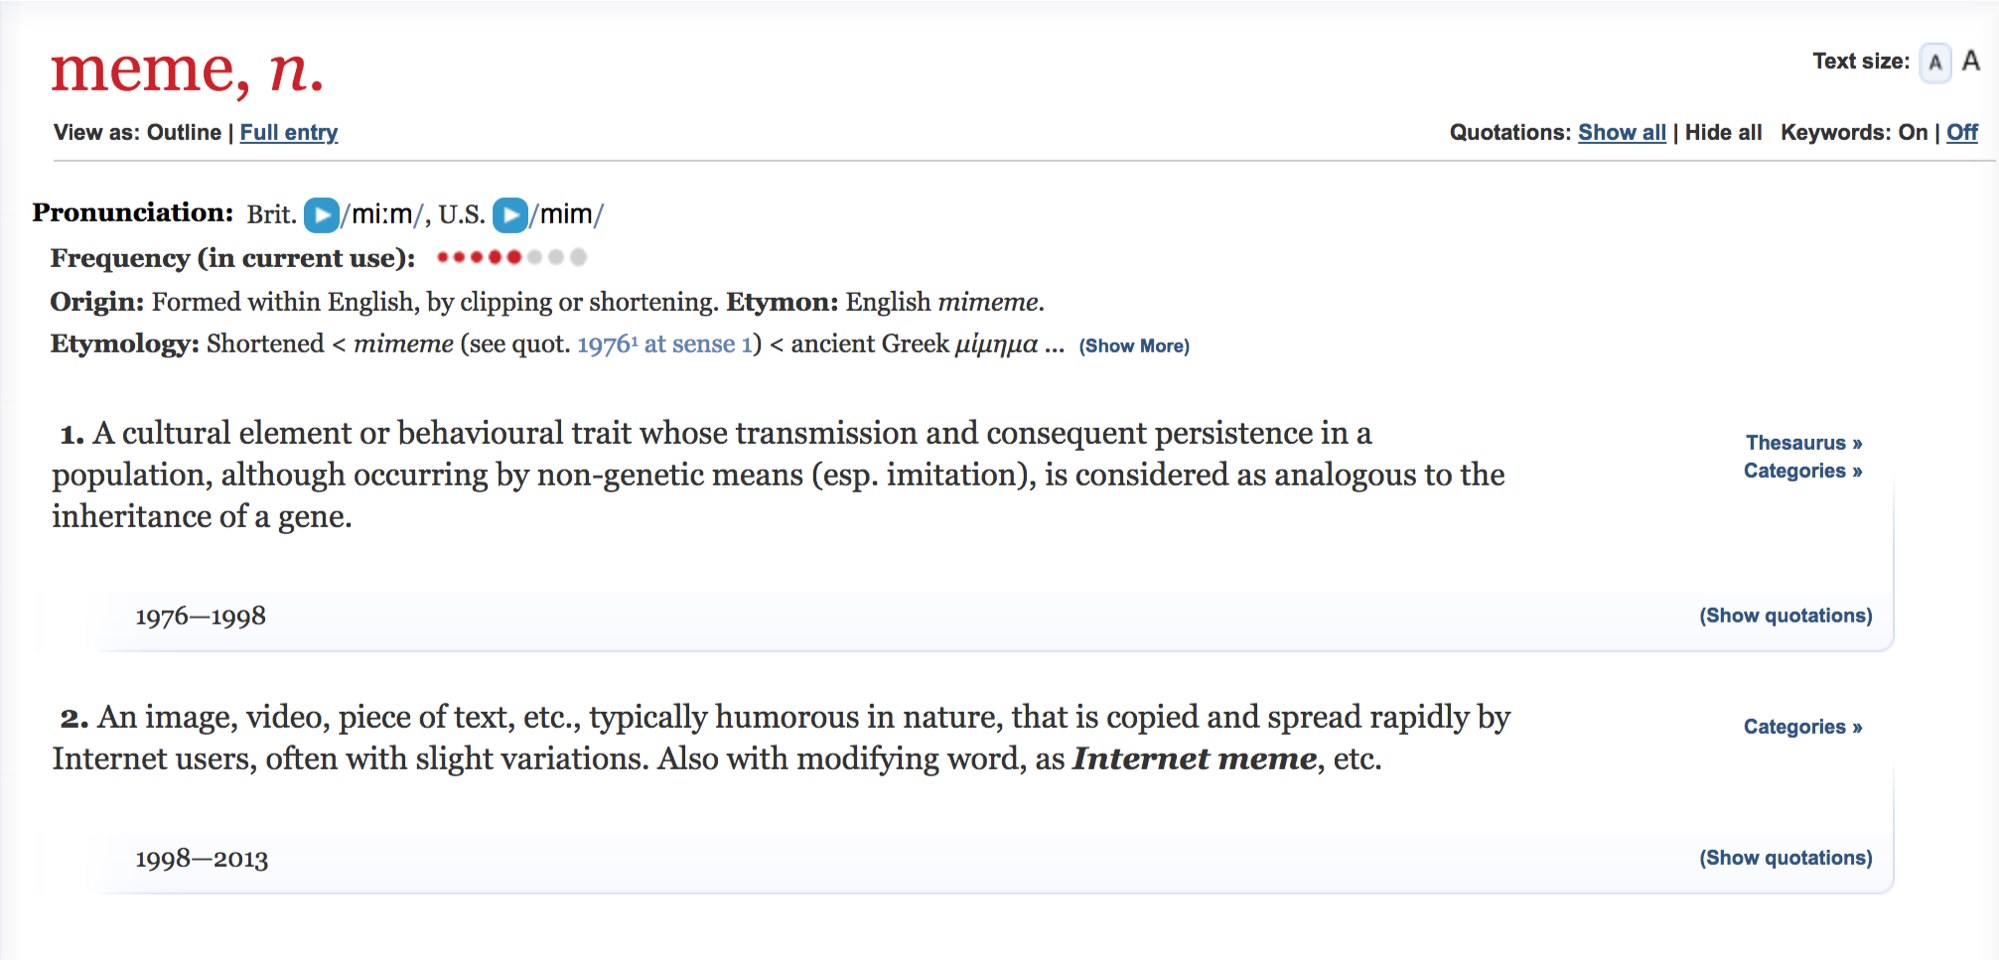
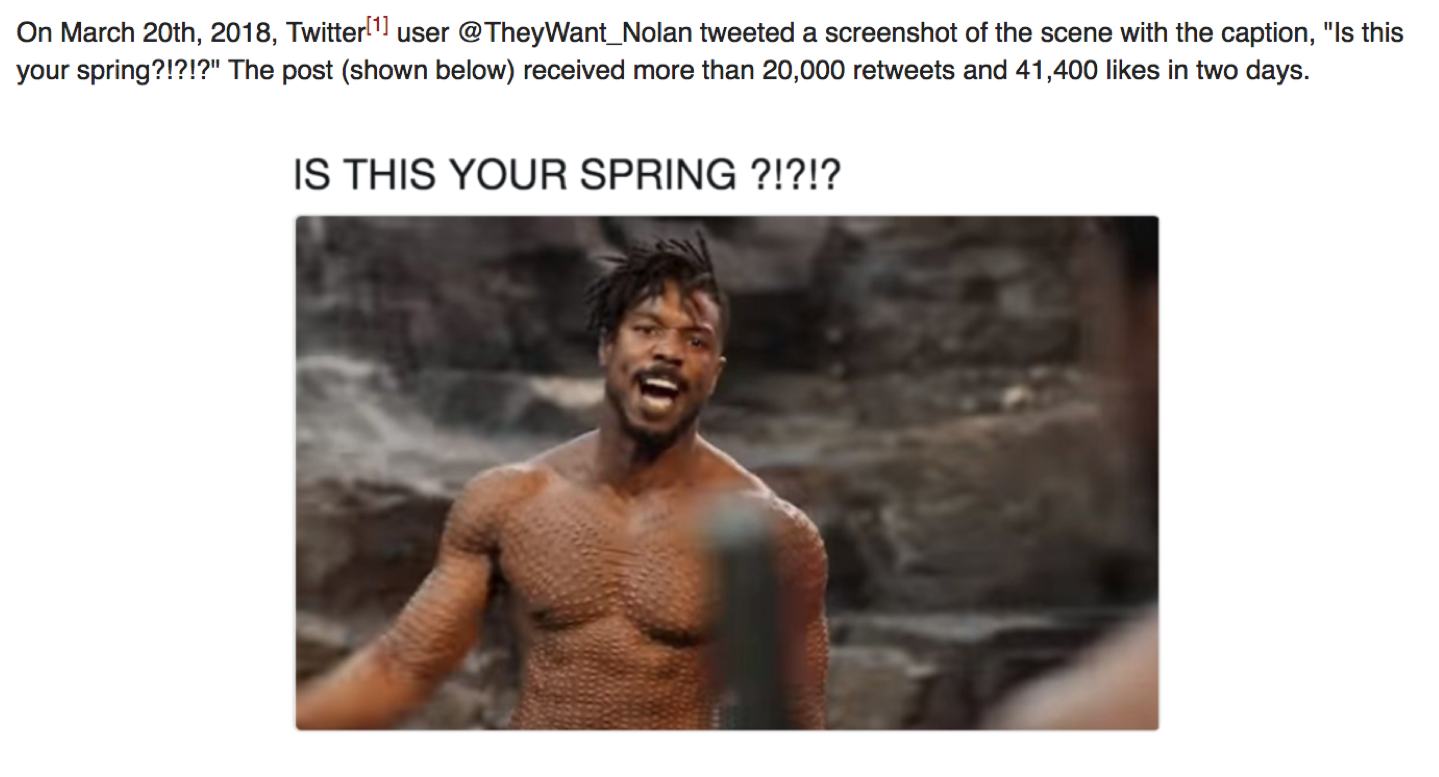
The word meme was coined in 1976 by Richard Dawkins in his book The Selfish Gene. In the Oxford English Dictionary, meme is defined as “a cultural element or behavioral trait whose transmission and consequent persistence in a population, although occurring by non-genetic means (especially imitation), is considered as analogous to the inheritance of a gene.” Dawkins was looking for a term to describe something that had existed for millennia – as long as humans have existed – and the examples he gave include tunes, ideas, catchphrases, clothes fashions, ways of making pots or building arches. These are all things that are picked up by a community, ideas and concepts that move among members of that community, are imitated and modified, and which are frequently moved on to new communities as well where the process of imitation and modification continues. More recently the term meme has been applied specifically to images or text shared, often with modification, on the Internet, particularly through social media: If you’ve ever been RickRolled, you have been on the receiving end of a particularly popular and virulent meme.
Following this theory, terms work like this:
- A term begins with a specific meaning (e.g., outlined in the OED, citing earlier usage),
- A scholar adopts the term because we need some way to describe this new thing that we’ve created. So we appropriate this term, with its existing meaning, and we use it to describe our new thing.
- The new thing takes on the old meaning of the term,
- The term itself becomes imbued with meaning from what we are now using it to describe.
- The next time someone uses that term, it carries along with it the new meaning.
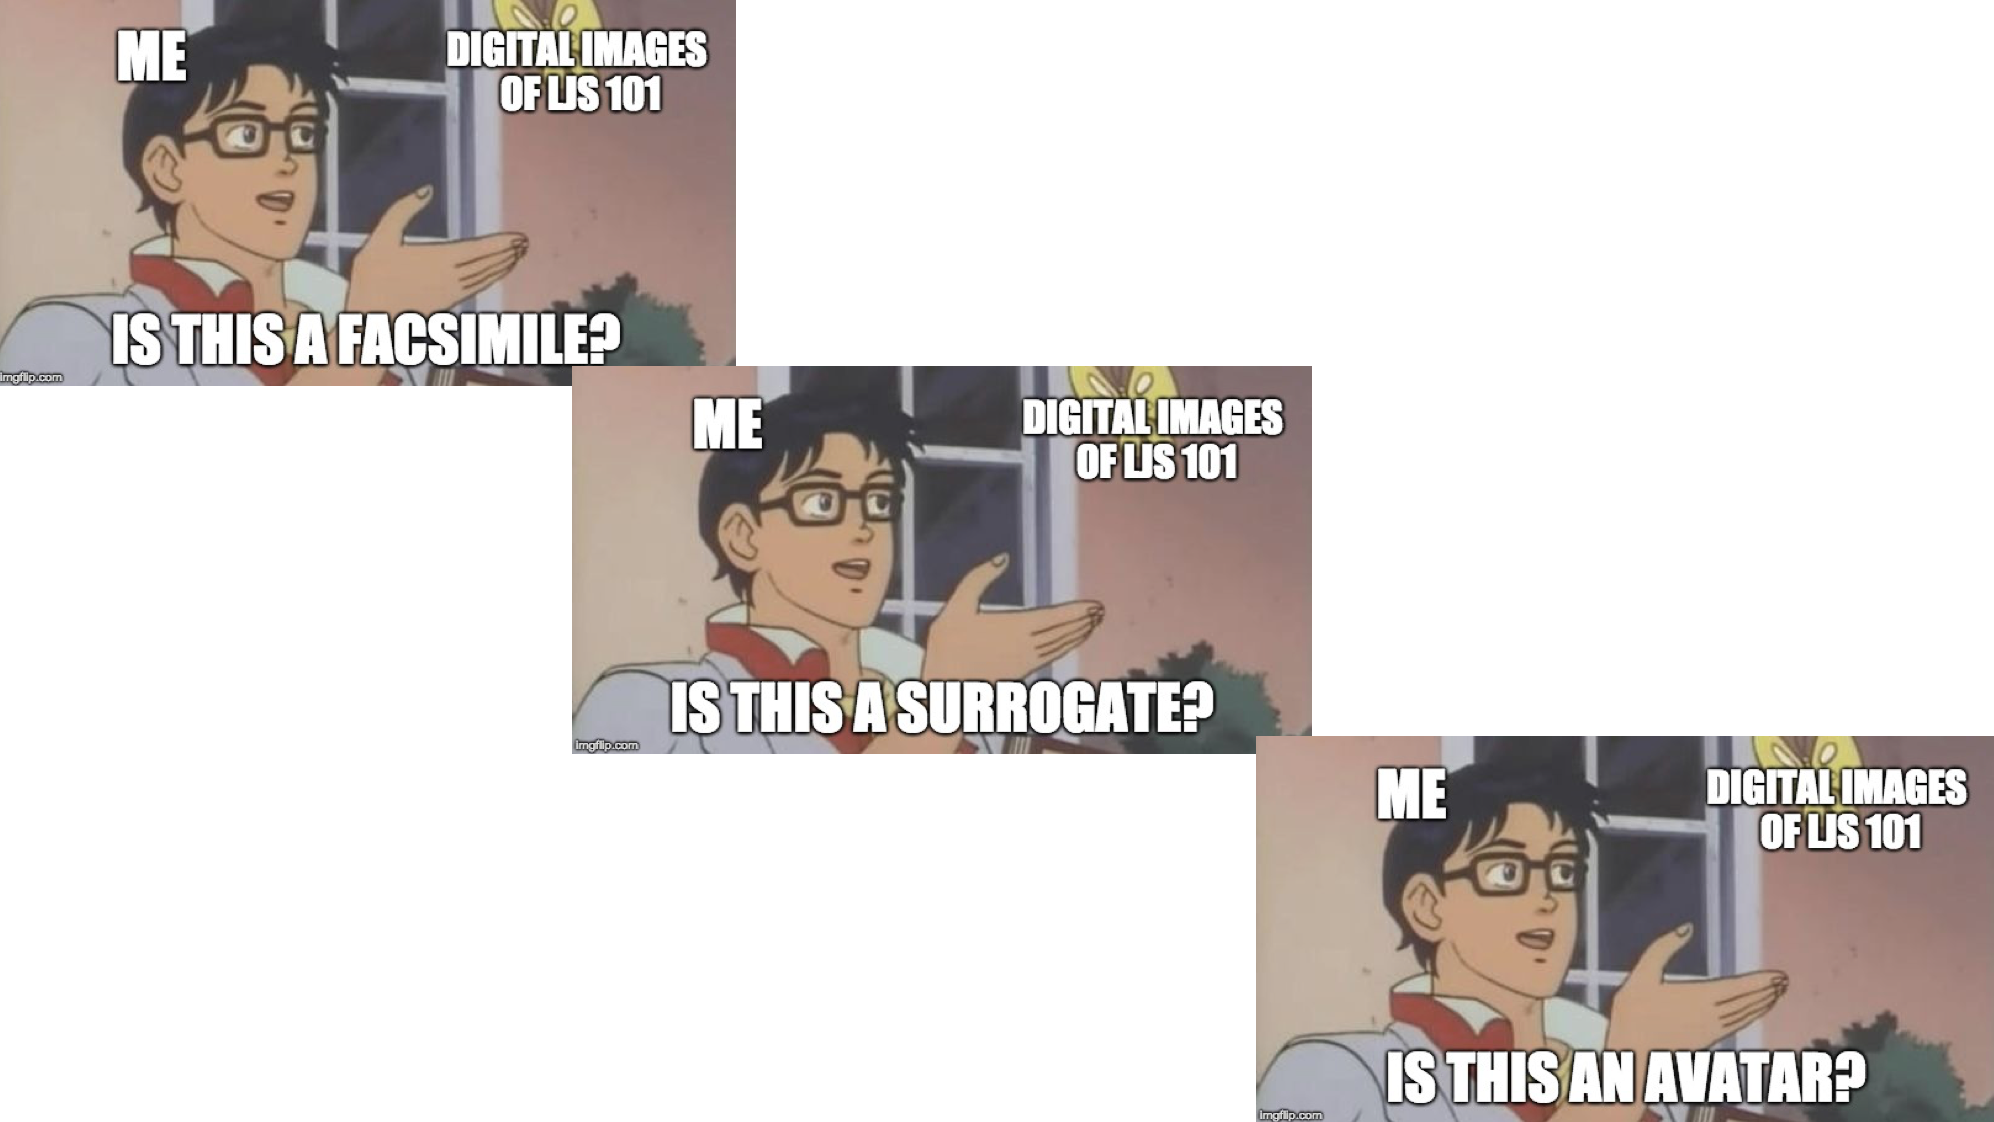
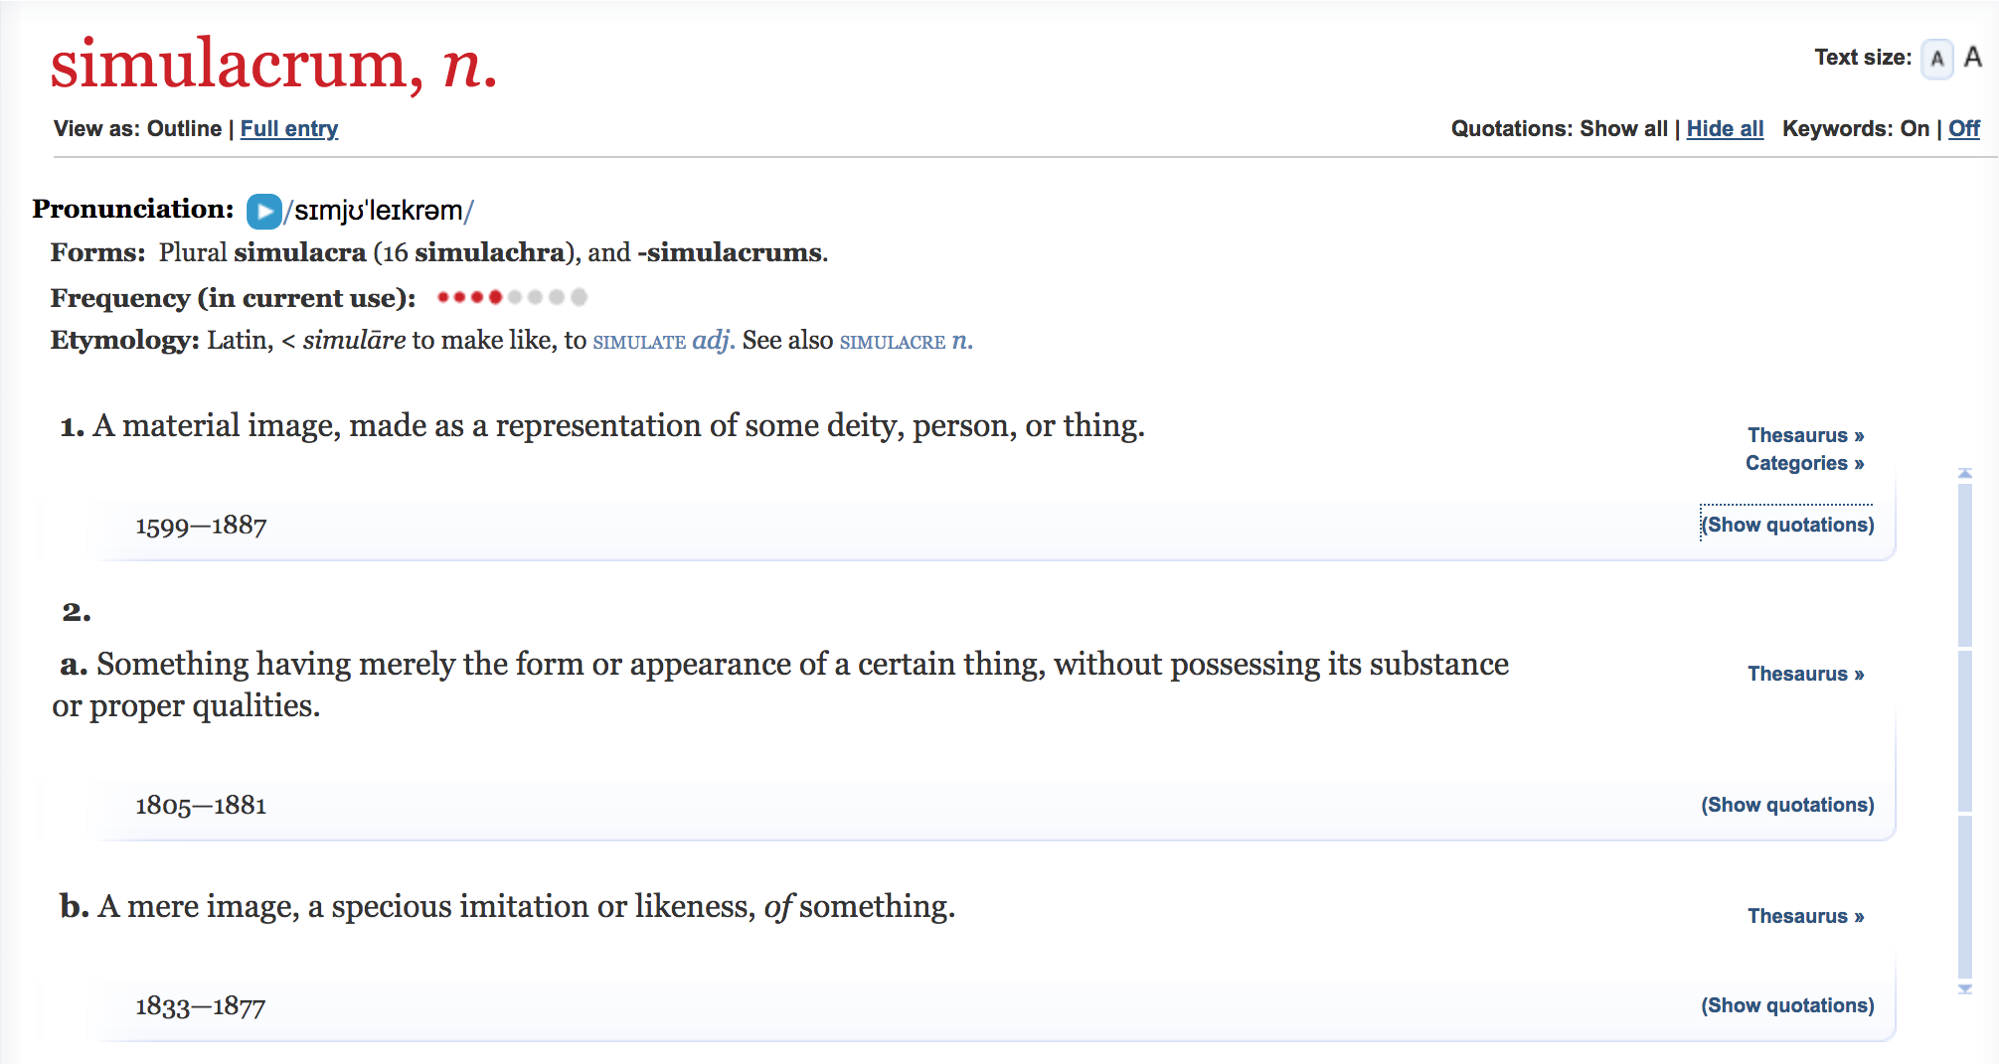
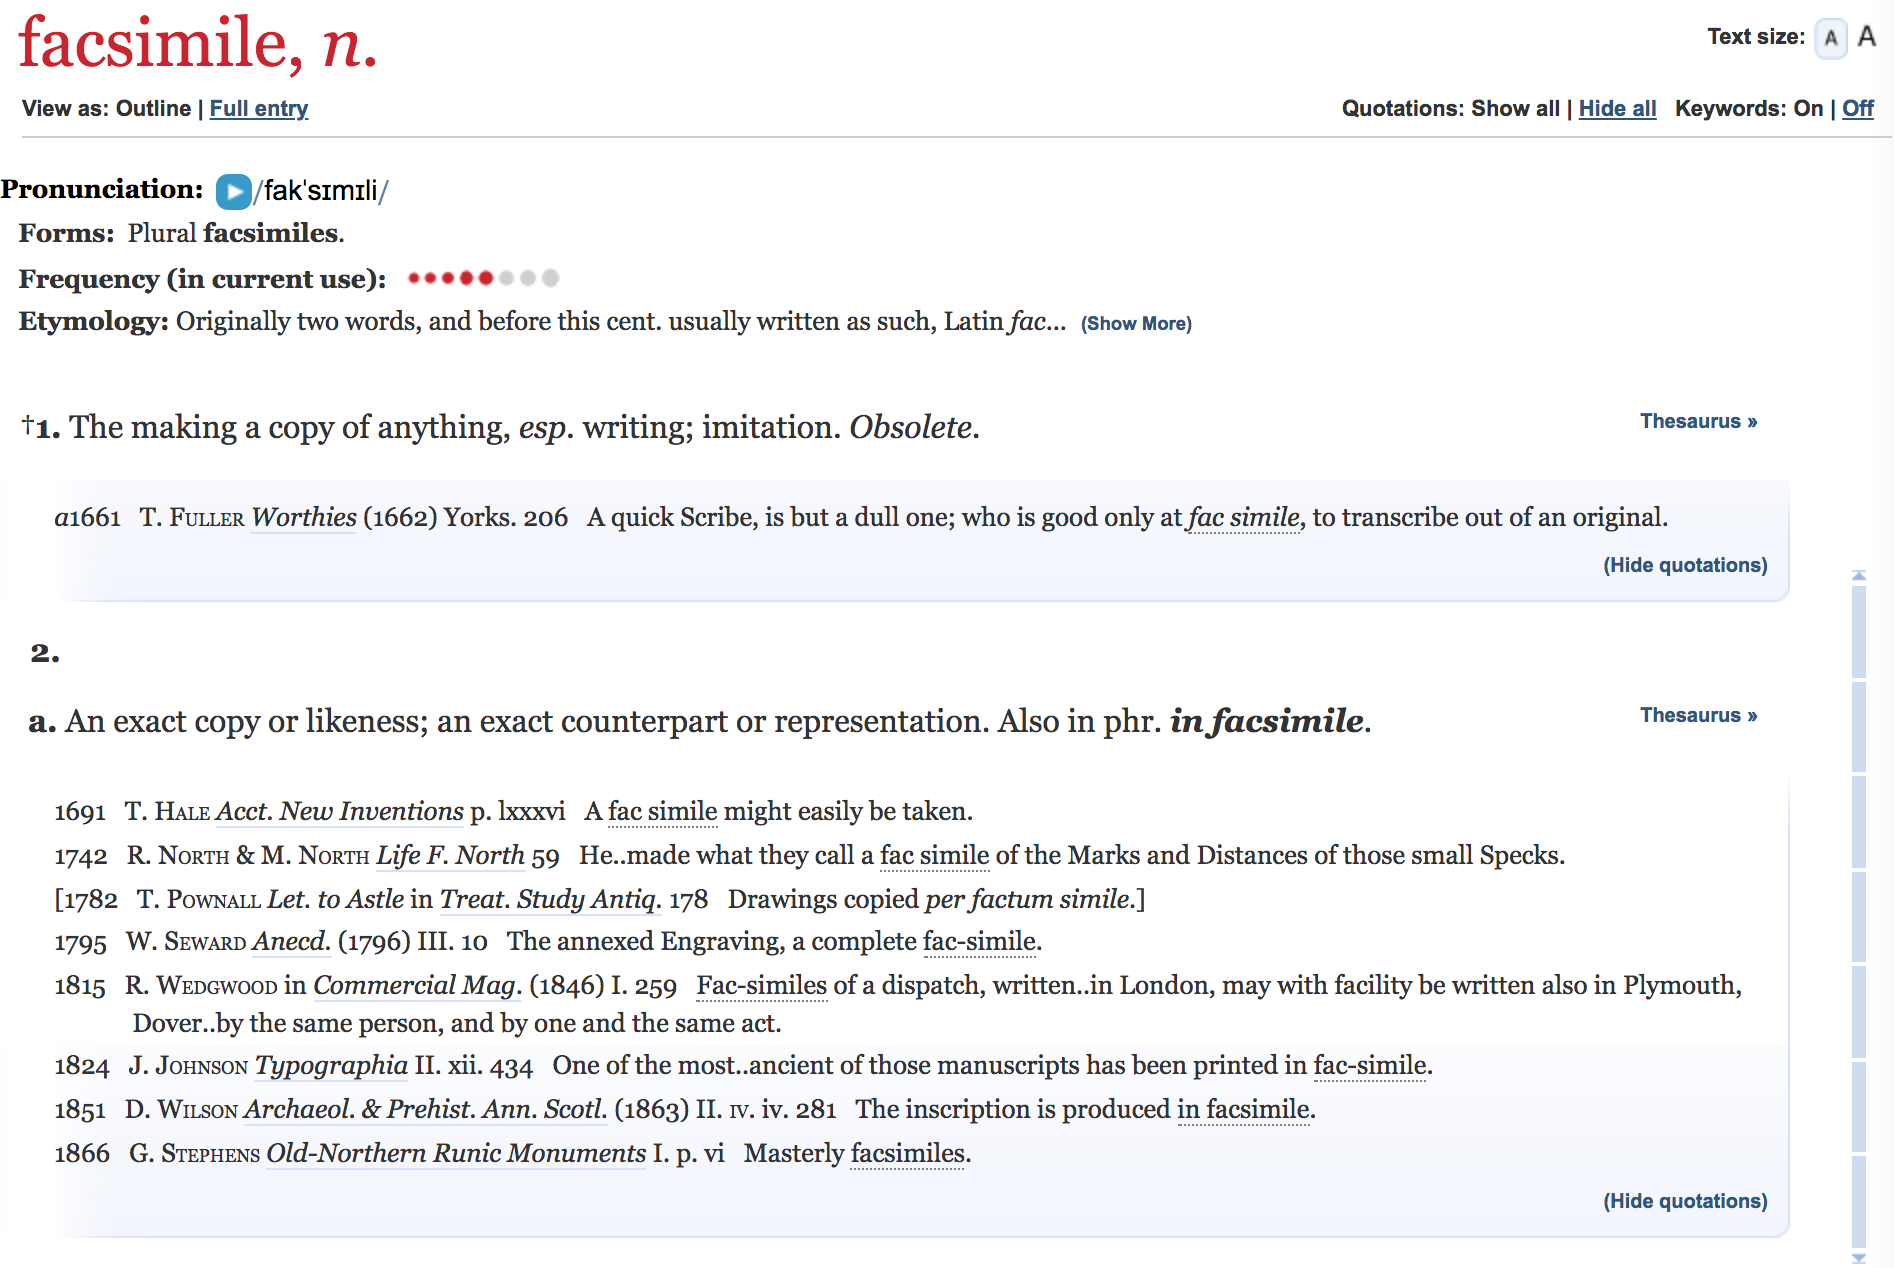
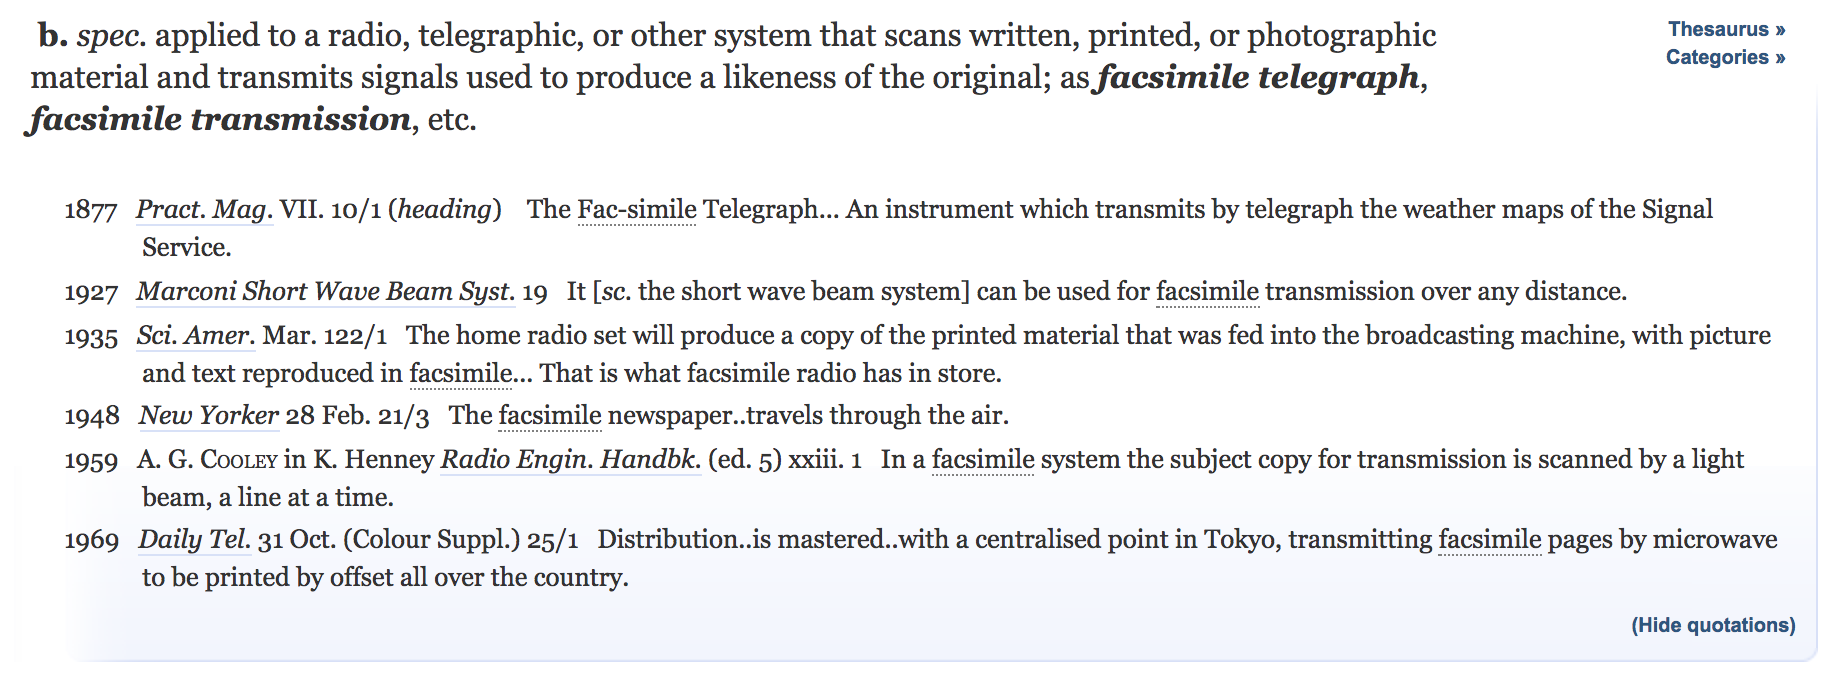
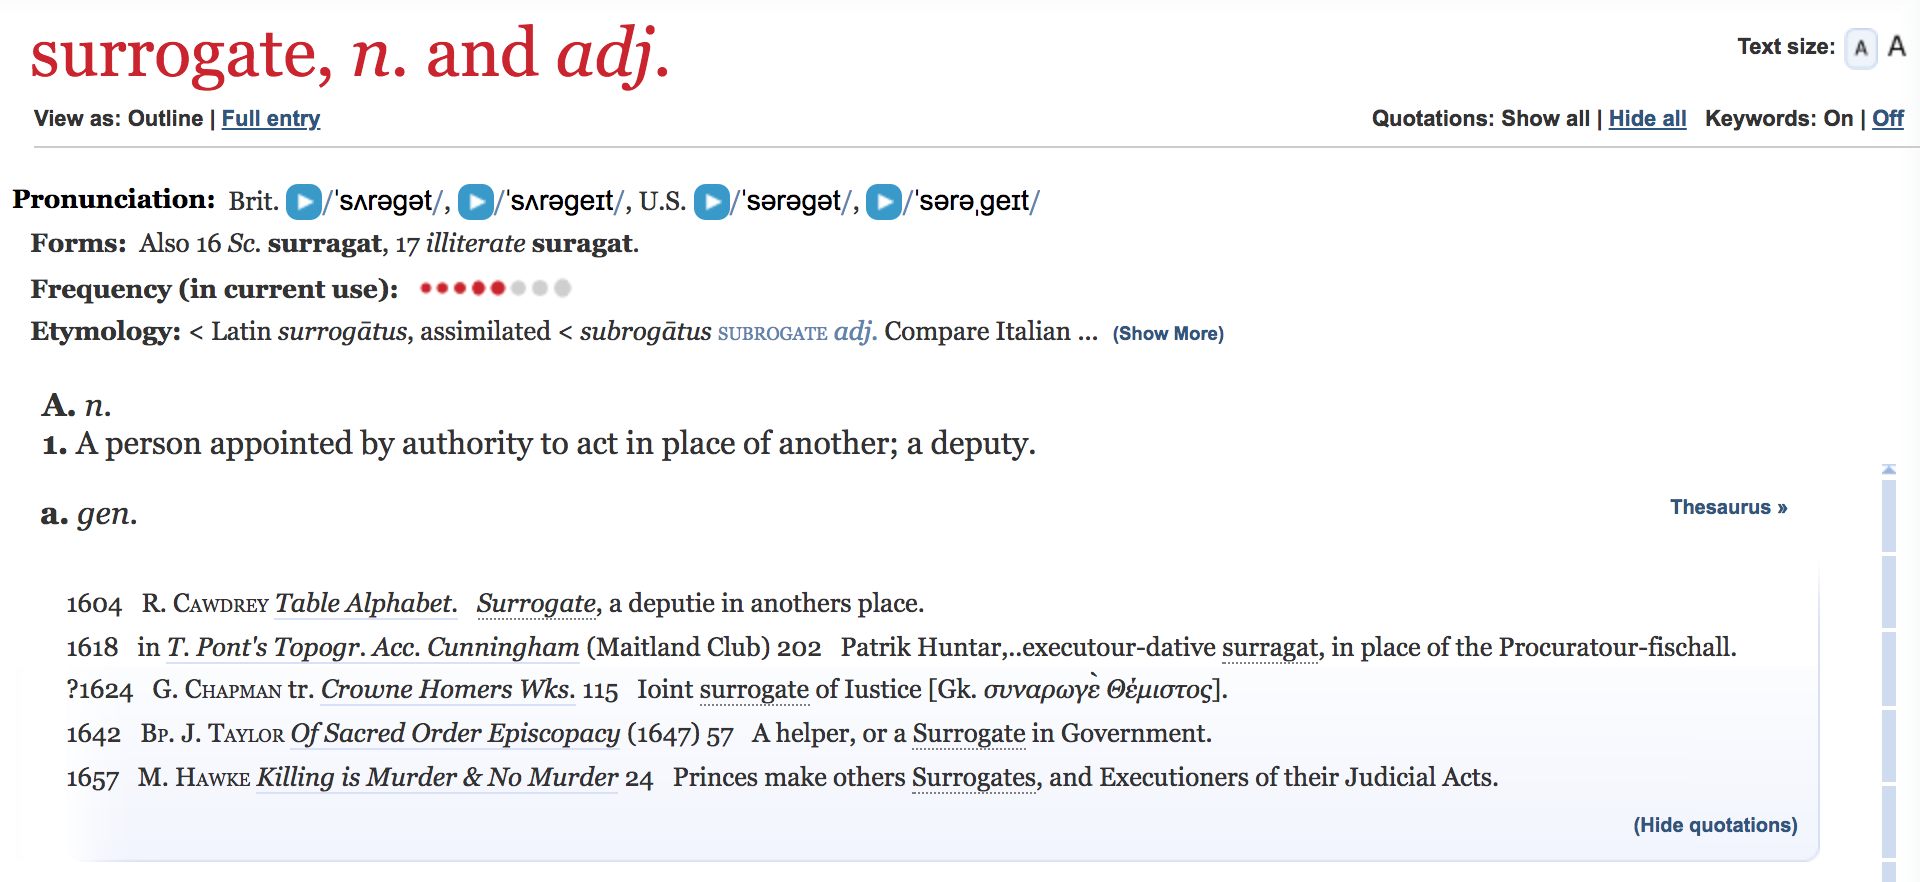
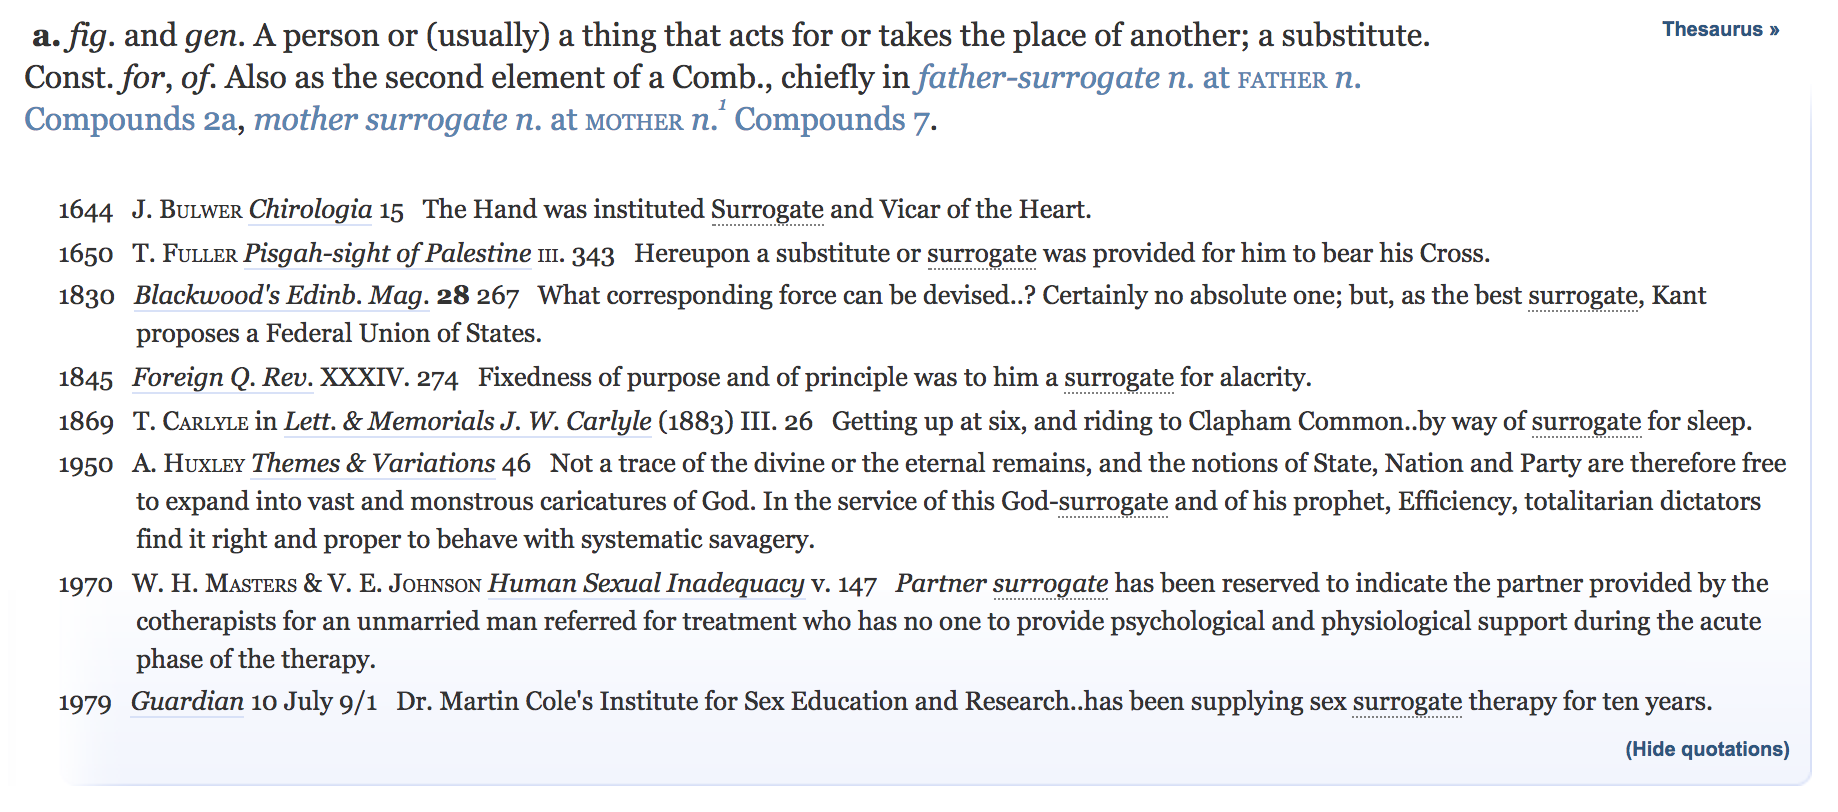
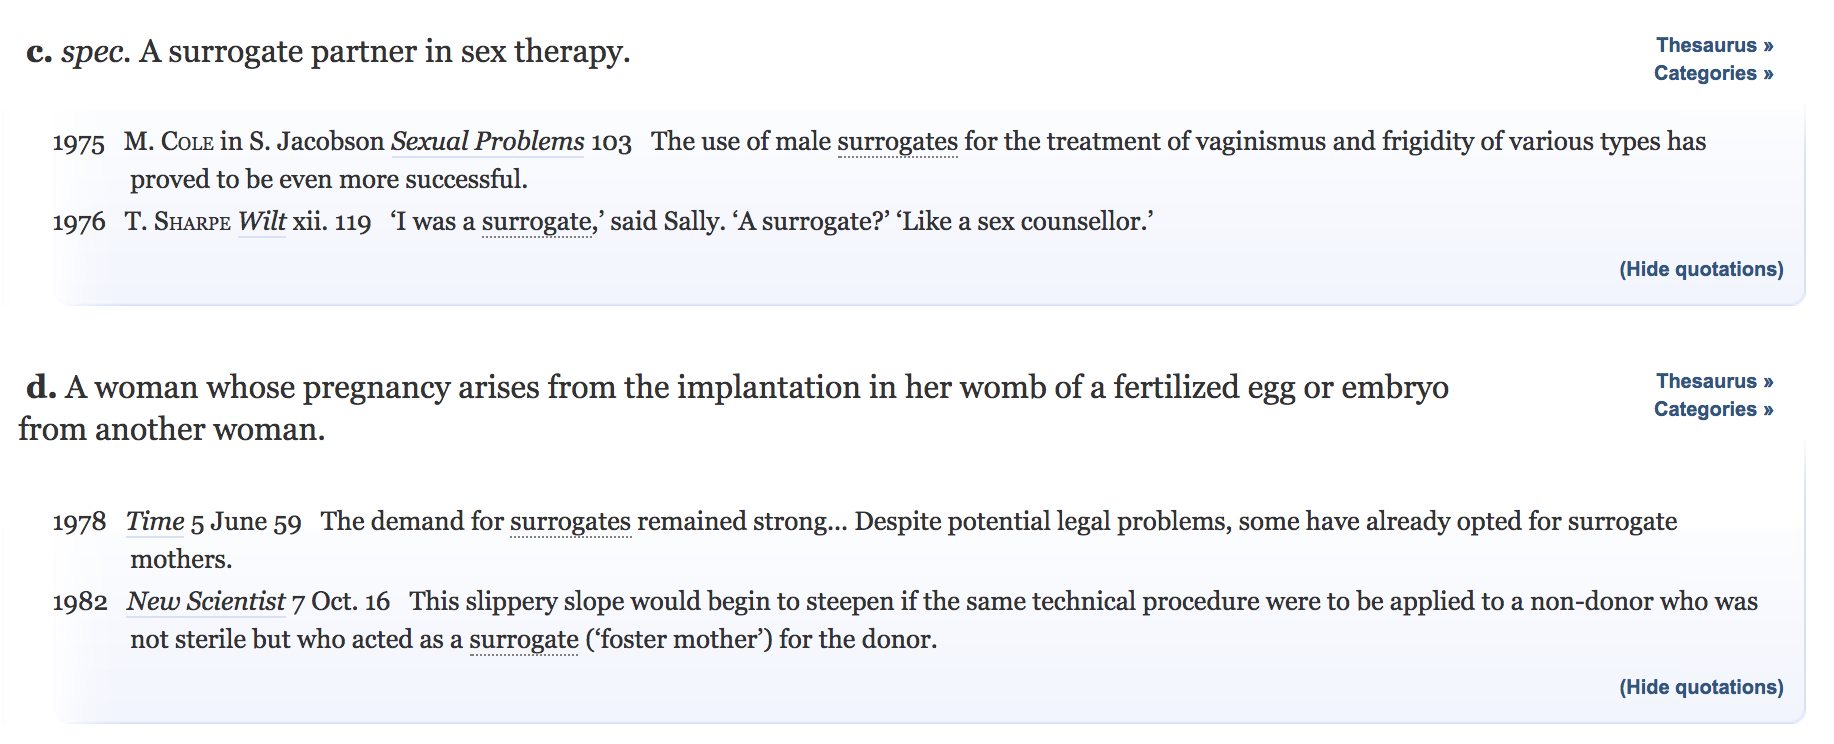
There are three terms that I see used a lot to refer to digitized manuscripts, but although we use these three terms – facsimile, surrogate, and avatar – to refer to digitized manuscripts, it is clear that these terms don’t mean the same thing, and that by choosing a specific term to refer to digitized manuscripts we are drawing attention to particular aspects of them. Facsimile literally means make similar, so if I call a digitized manuscript a facsimile, I draw attention to its status as a copy. Surrogate, on the other hand, generally means something that stands in for something else. So if I call it a surrogate, I draw attention to its status as a stand-in for the physical object. Avatar, finally, refers to manifestation, originally a god manifesting in human form, but now used to refer to people or physical objects manifesting in digital form. So if I call it an avatar, I draw attention to its status as a representation of the physical object in a digital world. Not a copy, not a replacement, but another version of that thing.
I would like to remark on our apparent desire as a community to apply meaning to digital version of manuscripts by using existing terms, rather than by inventing new terms. After all, we coin new words all the time, so it would be understandable if we decided to make up a new term rather than reusing old ones. But as far as I know we haven’t come up with a completely new term for “digitized medieval manuscript,” and if anyone has it hasn’t caught up enough to be reused widely in the scholarly community. I expect this comes from a desire to describe a new thing in terms that are understandable, as well as to define the new thing according to what came before. Digital versions of manuscripts are new things that have a close relationship with things that existed before, so while we want to differentiate them we also want to be able to acknowledge their similarities, and one way to do that is through the terms we call them.
Like pushing an idea through different memes, pushing the concept of a digitized manuscript through different terms give us flexibility in how we consider them and how we explain them, and our feelings about them, to our audiences. That we can so easily apply terms with vastly different meanings to the digital versions of manuscripts says something about the complexity of these objects and their digital counterparts.
Transformative Works / Language of Care
Another aspect that I’ve been looking into is coming up with a way to talk about manuscripts and manuscript digitization using the language of transformative works. (First presented at the International Medieval Congress, Leeds)
Transformative work is a concept that comes out of fandom: that is, the fans of a particular person, team, fictional series, etc. regarded collectively as a community or subculture. We typically talk about fandom in relation to sports, movies, or TV shows, but people can be fans of many things (including manuscripts). As defined on the Fanlore wiki:
“Transformative works are creative works about characters or settings created by fans of the original work, rather than by the original creators. Transformative works include but are not limited to fanfiction, real person fiction, fan vids, and graphics. A transformative use is one that, in the words of the U.S. Supreme Court, adds something new, with a further purpose or different character, altering the [source] with new expression, meaning, or message.”
In some fandom communities, transformative works play a major role in how the members of that fandom communicate with each other and how they interact with the canon material (“canon” being the term fans use to refer the original work). Transformative works start with canon but then transform it in various ways to create new work – new stories, new art, new ideas, possible directions for canon to take in the future, directions canon would never take but which are fun or interesting to consider.
Although it’s still quite niche there is a small but growing academic movement to apply the concept of transformative work to historical texts. Some of this work is happening through the Organization for Transformative Works, which among other things hosts Archive of our Own, a major site for fans to publish their fanworks, and provides legal advocacy for creators of fanworks.
The Organization for Transformative Works also publishes a journal, Transformative Works and Cultures, and in 2016 they published an issue “The Classical Canon and/as Transformative Work,” which focused on relating ancient historical and literary texts to the concept of fan fiction (that is, stories that fans write that feature characters and situations from canon). There is also a call for papers currently open for an upcoming special journal issue on “Fan Fiction and Ancient Scribal Culture,” which will “explore the potential of fan fiction as an interpretative model to study ancient religious texts.” This special issue is being edited by a group of scholars who lead the “Fan Fiction and Ancient Scribal Cultures” working group in the European Association of Biblical Studies, which organized a conference on the topic in 2016.
You will note that the academic work on transformative works I’ve cited focus specifically on fan fiction’s relationship with classical and medieval texts, which makes a fair amount of sense given the role of textual reuse in the classical and medieval world. In her article “The Role of Affect in Fan Fiction ,” published in the Transformative Works and Cultures special issue of 2016, Dr. Anna Wilson places fan fiction within the category of textual reception, wherein texts from previous times are received by and reworked by future authors. In particular, Dr. Wilson points to the epic poetry of classical literature, medieval romance poetry, and Biblical exegesis, but she notes that comparisons between fan fiction and these past examples of textual reception are undertheorized, and leave out a major aspect of fan fiction that is typically not found, or even looked for, in the past examples. She says, “To define fan fiction only by its transformative relationship to other texts runs the risk of missing the fan in fan fiction—the loving reader to whom fan fiction seeks to give pleasure. Fan fiction is an example of affective reception. While classical reception designates the content being received, affective reception designates the kind of reading and transformation that is taking place. It is a form of reception that is organized around feeling.” (Wilson, 1.2)
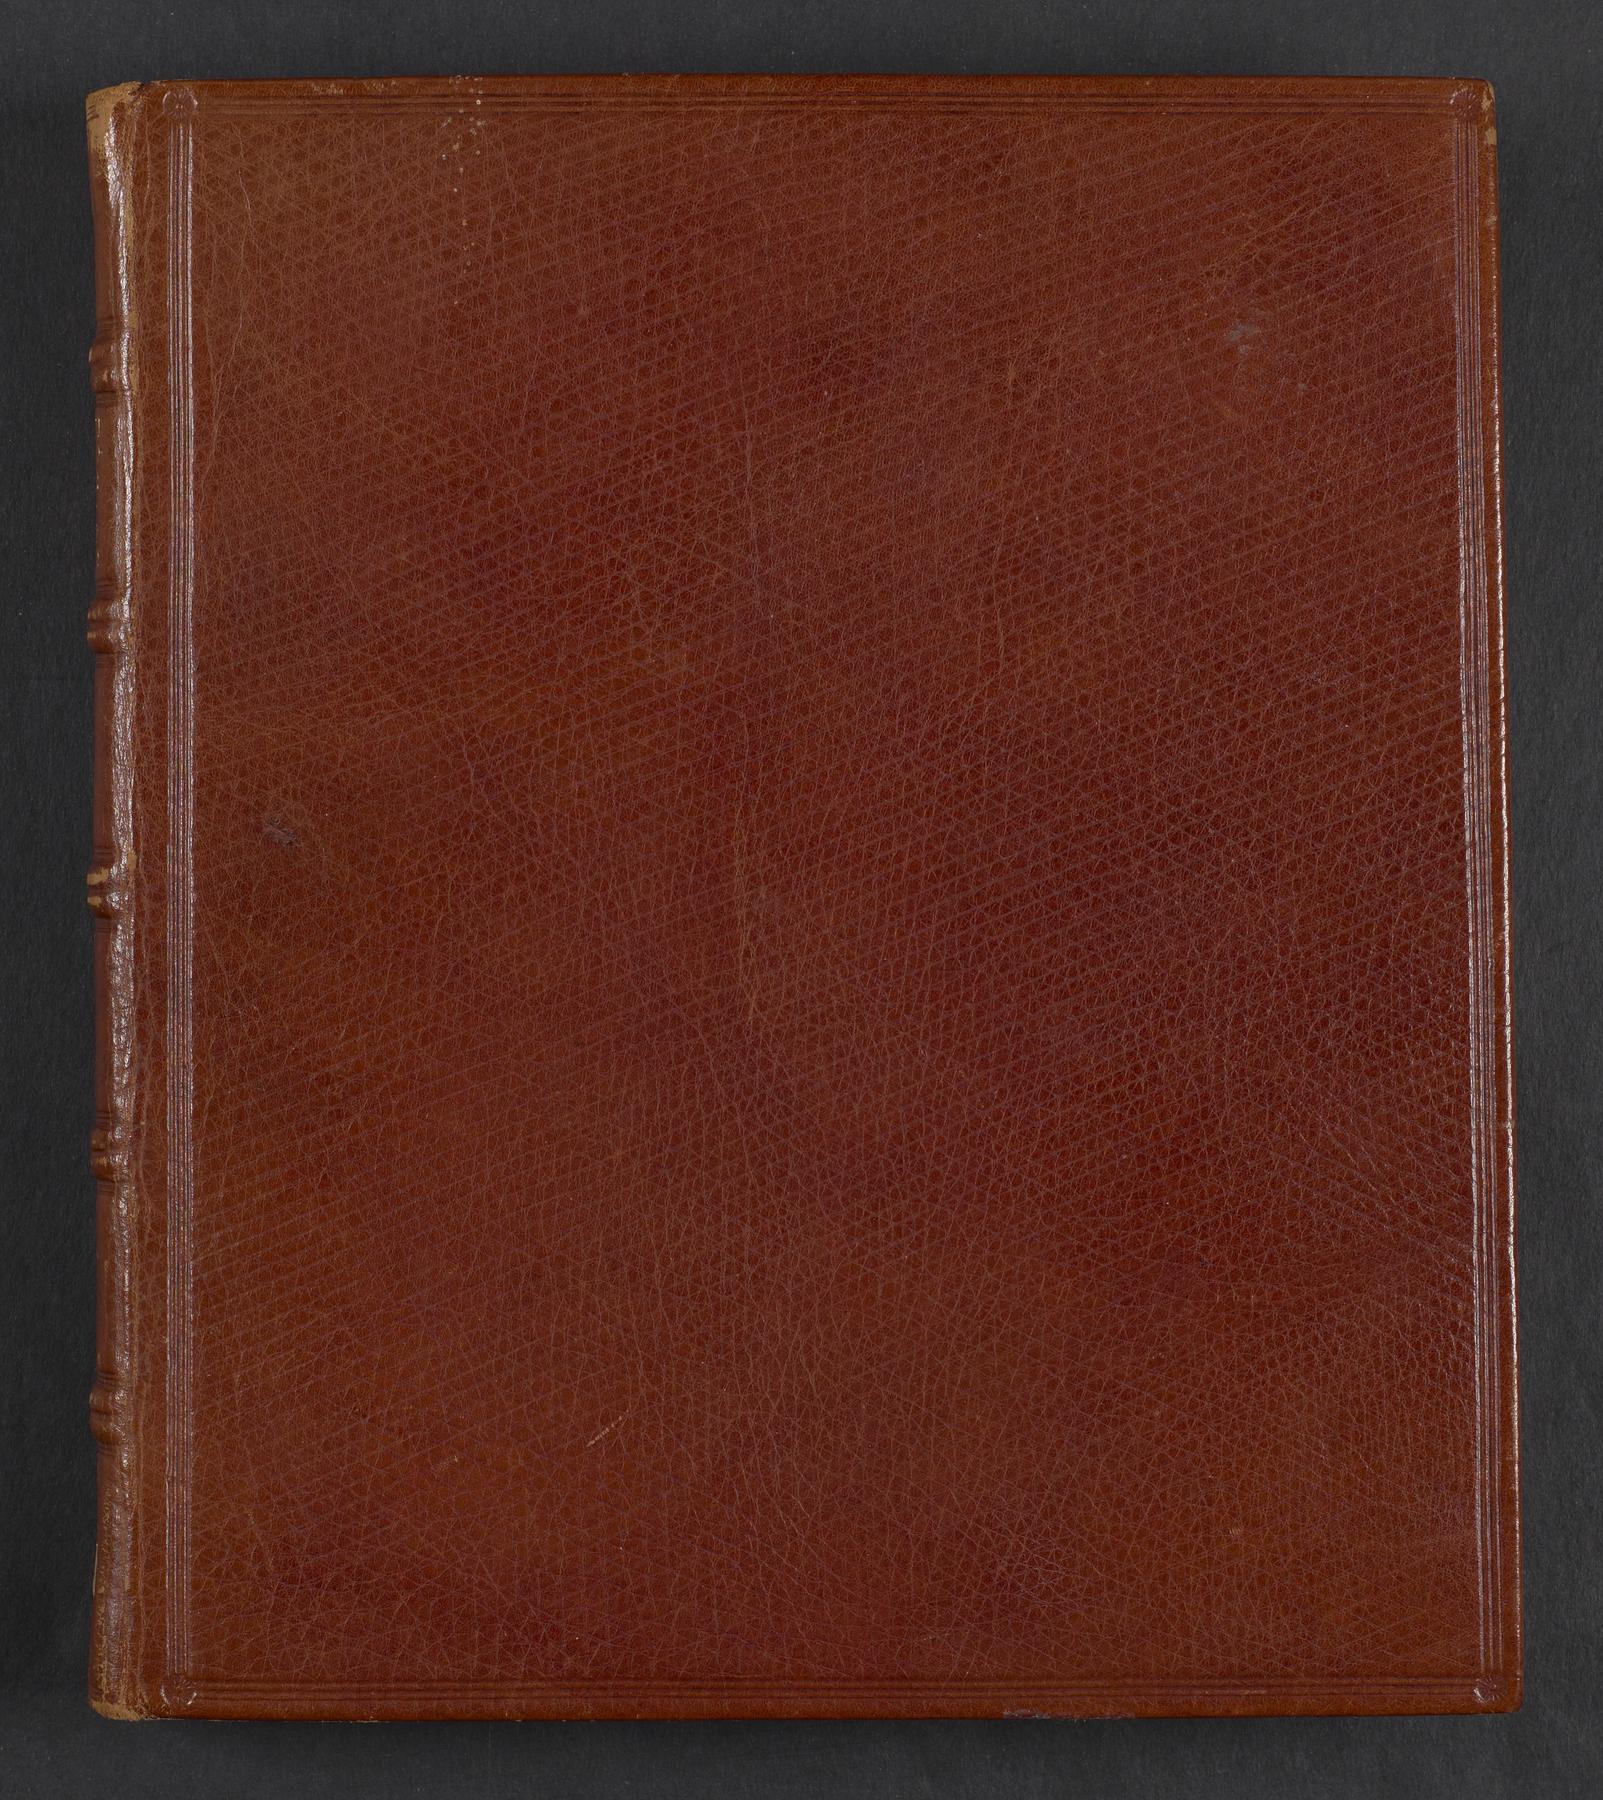
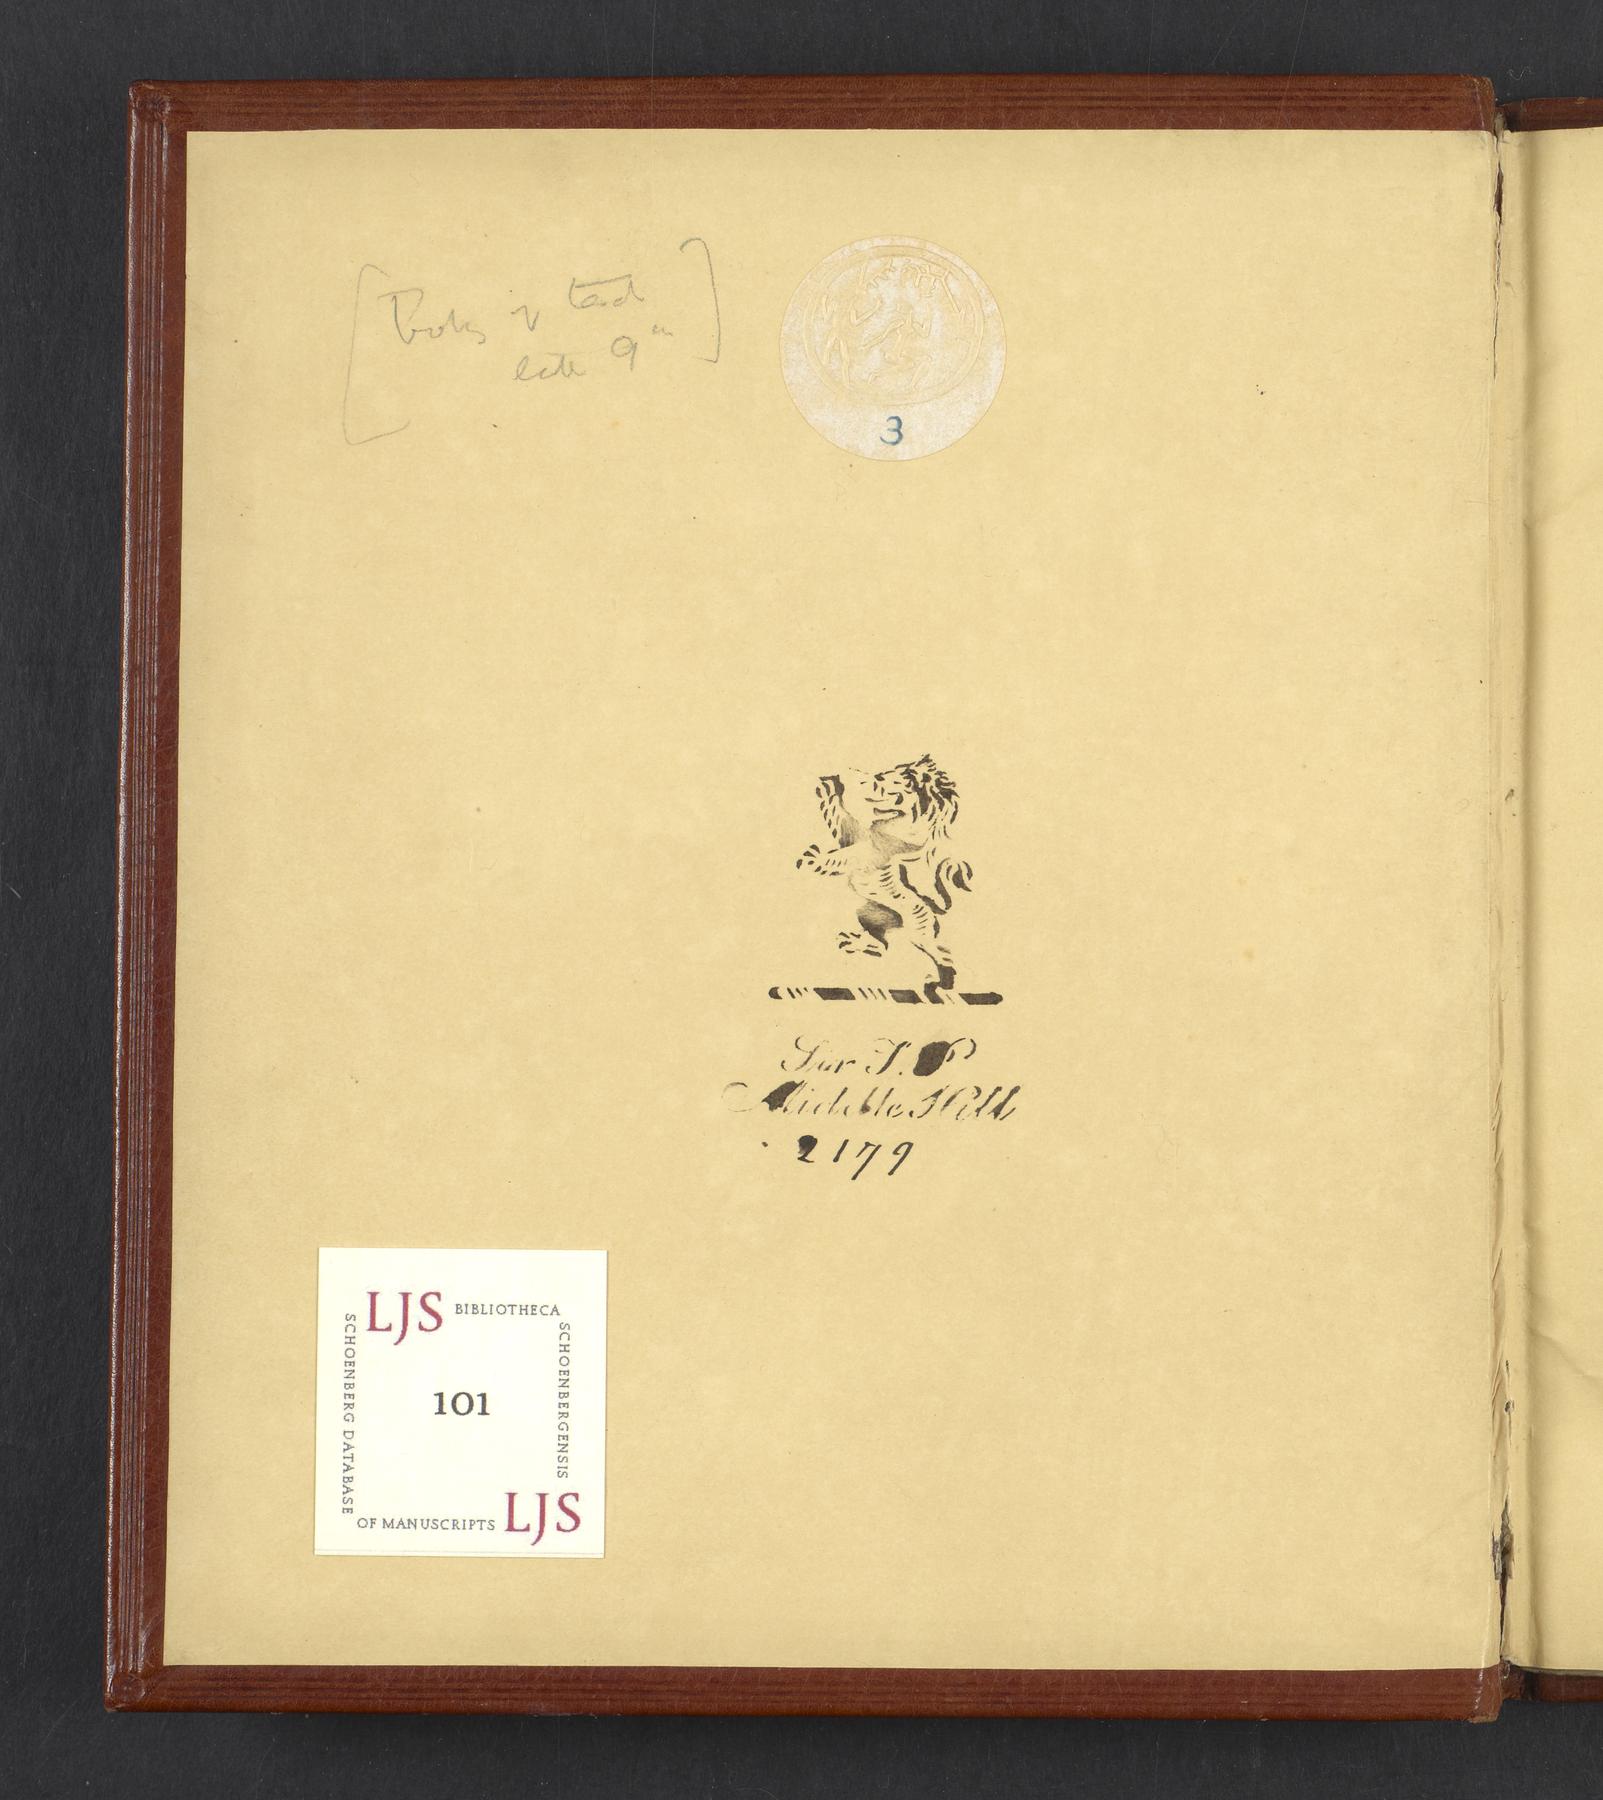
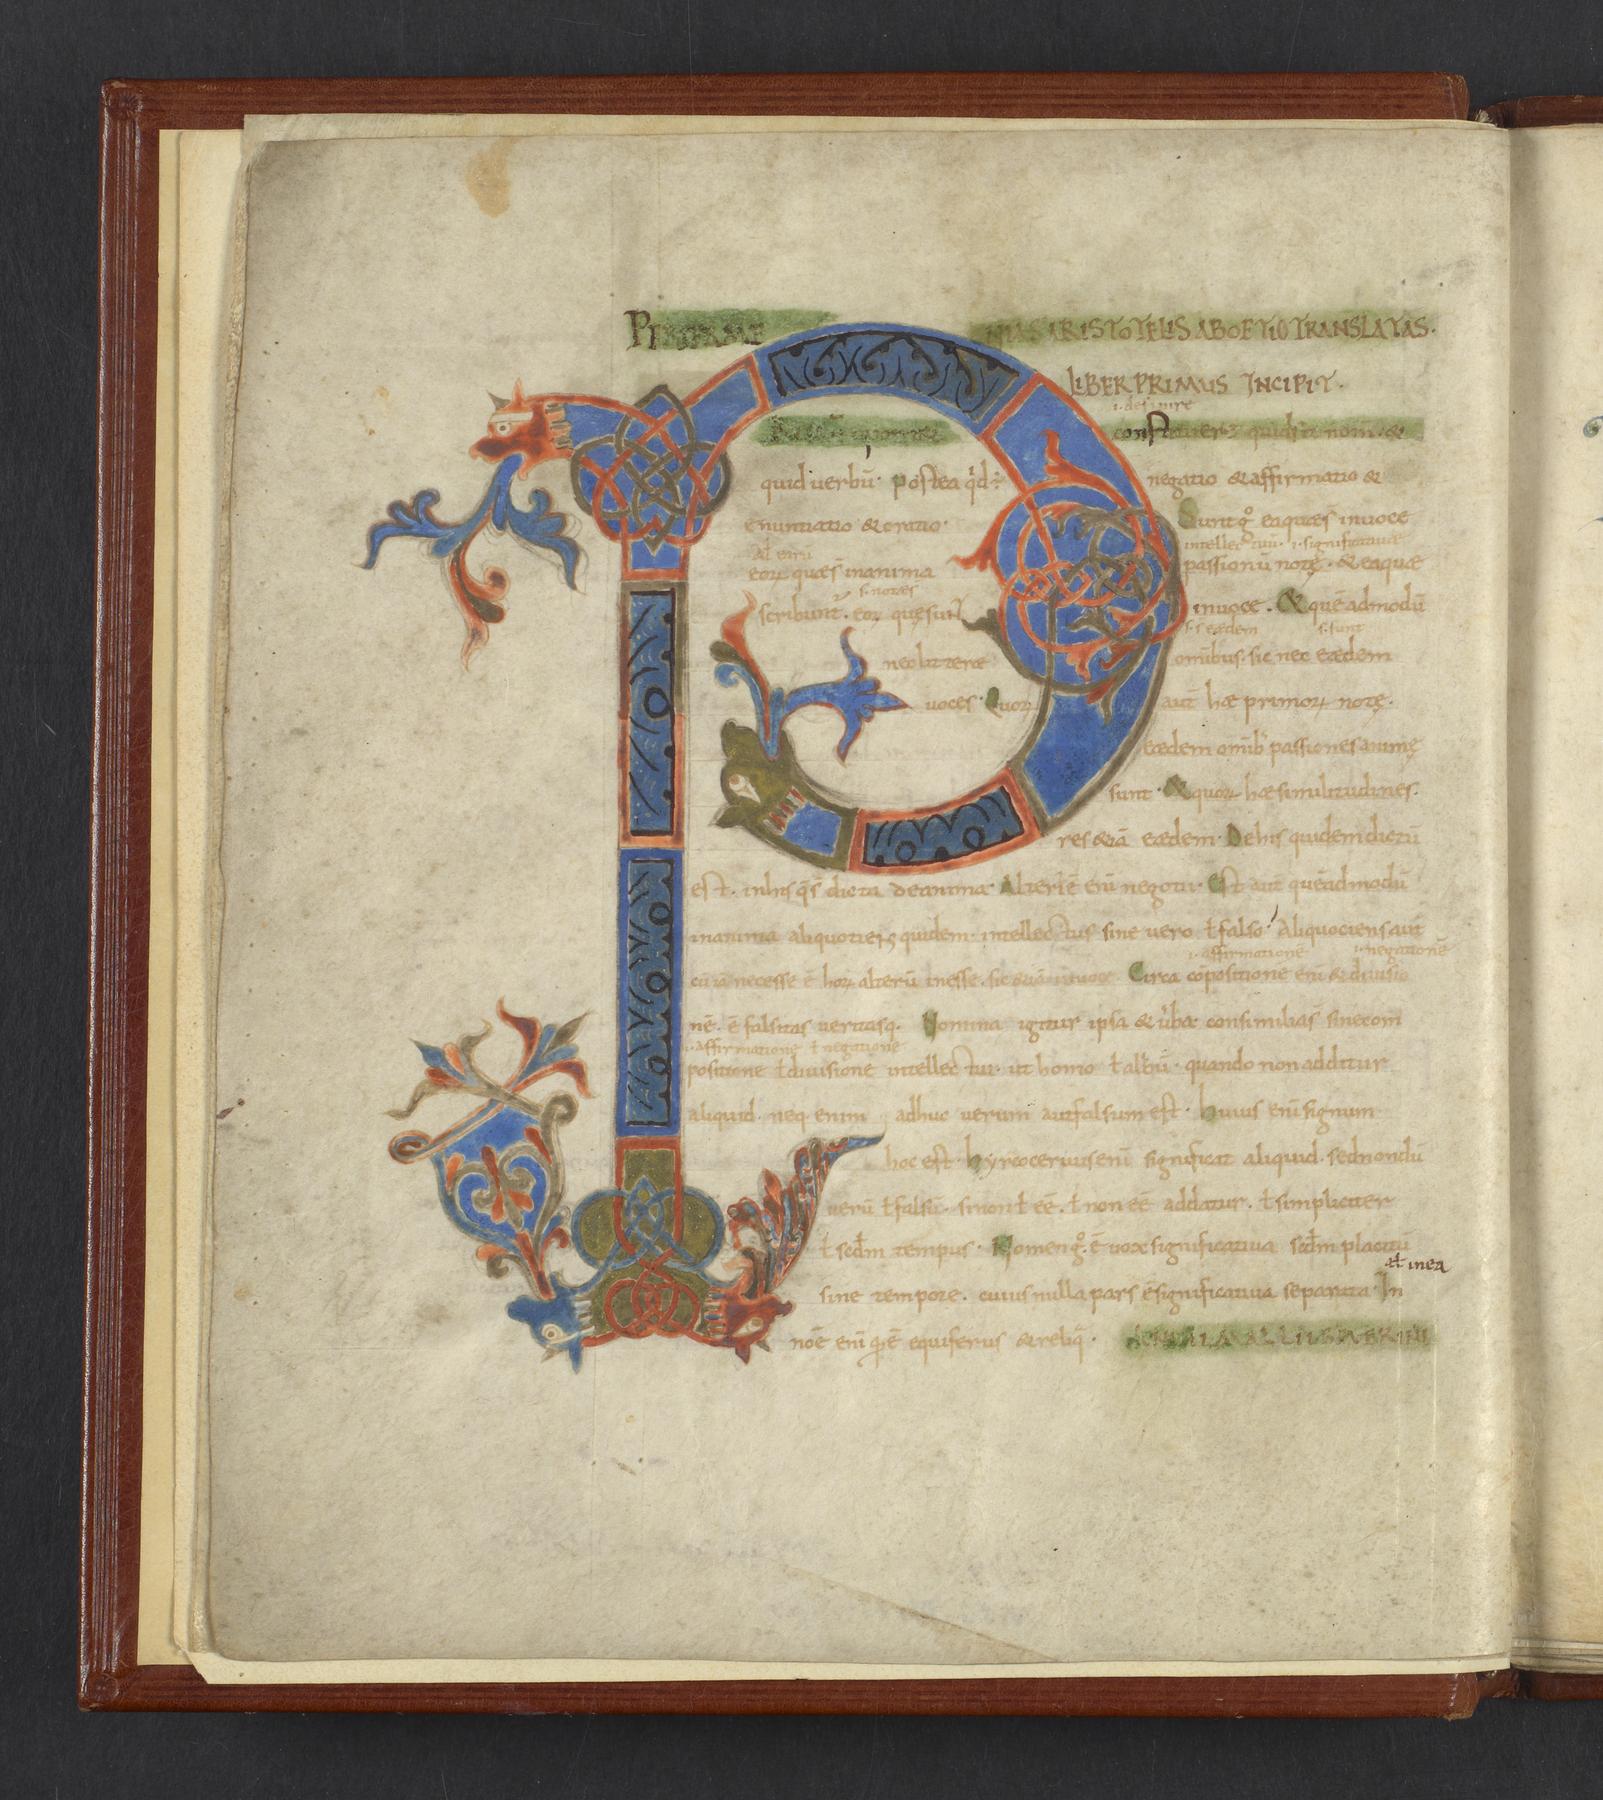
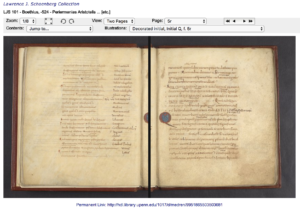
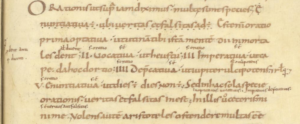
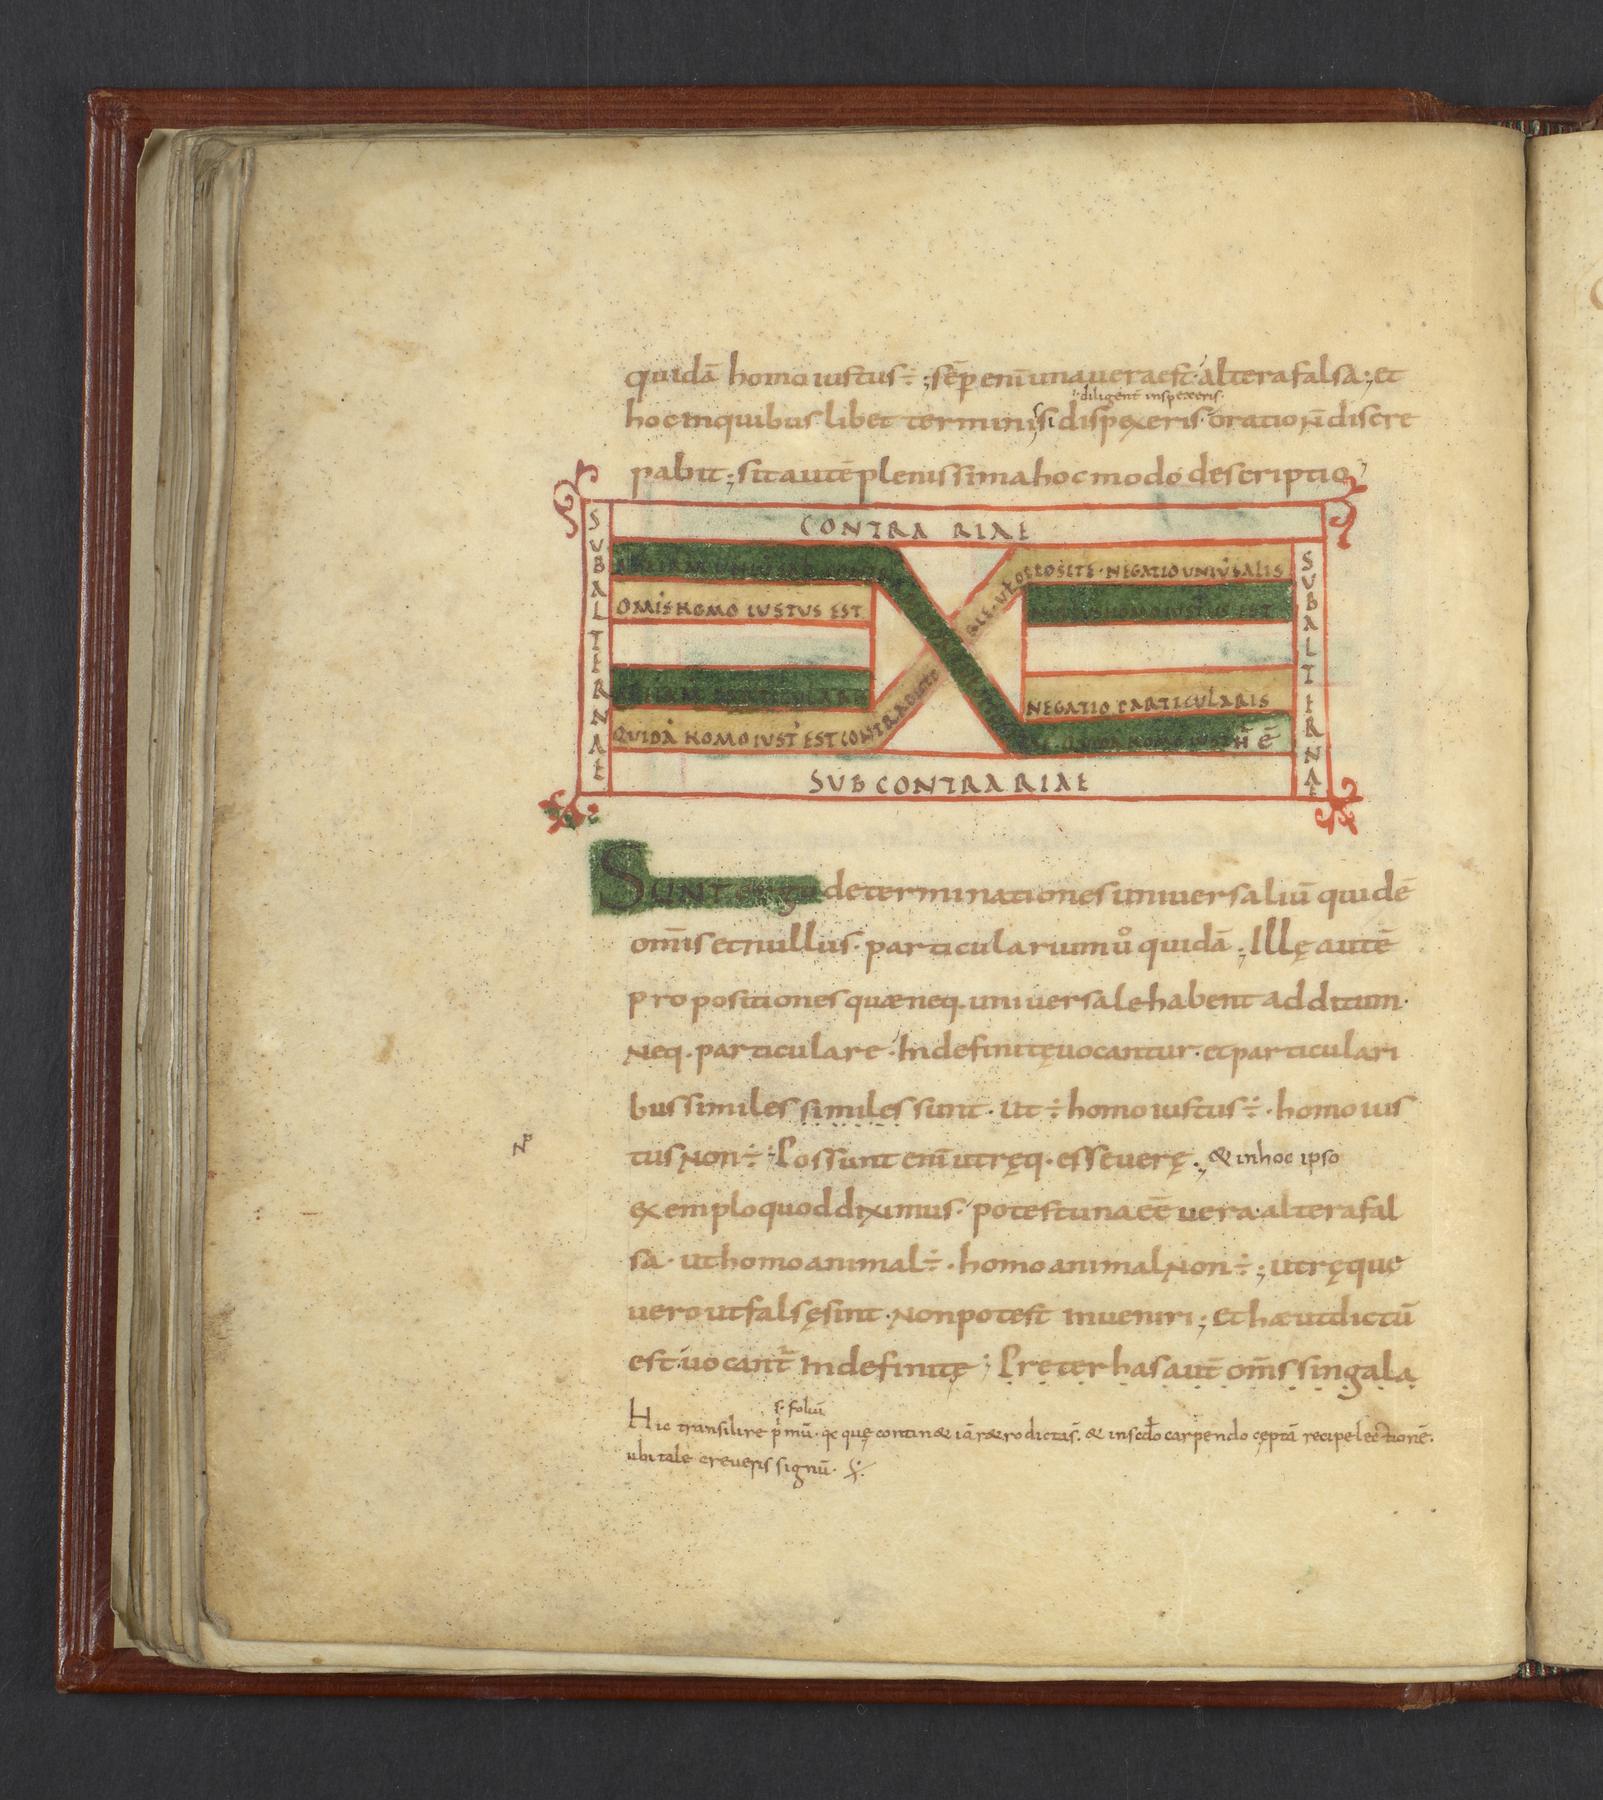
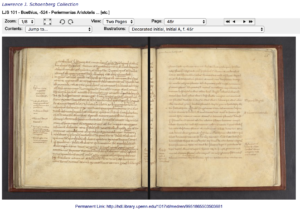
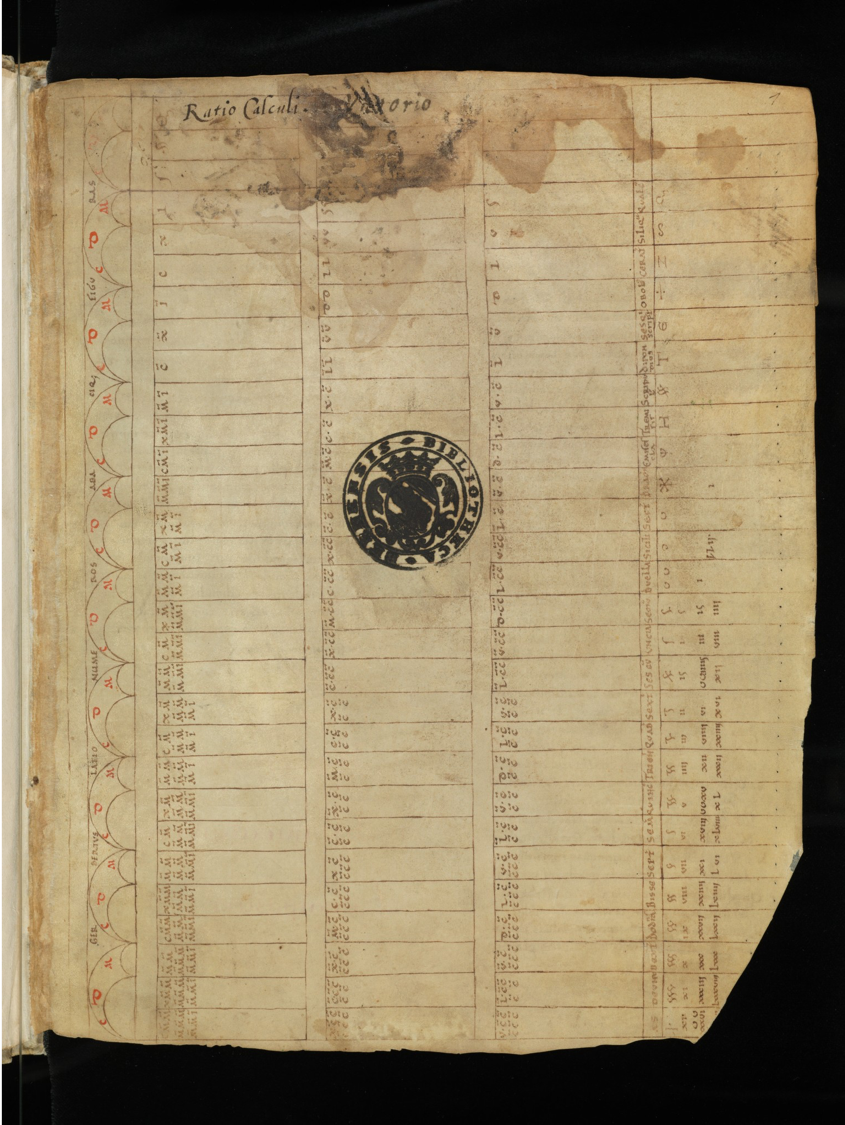
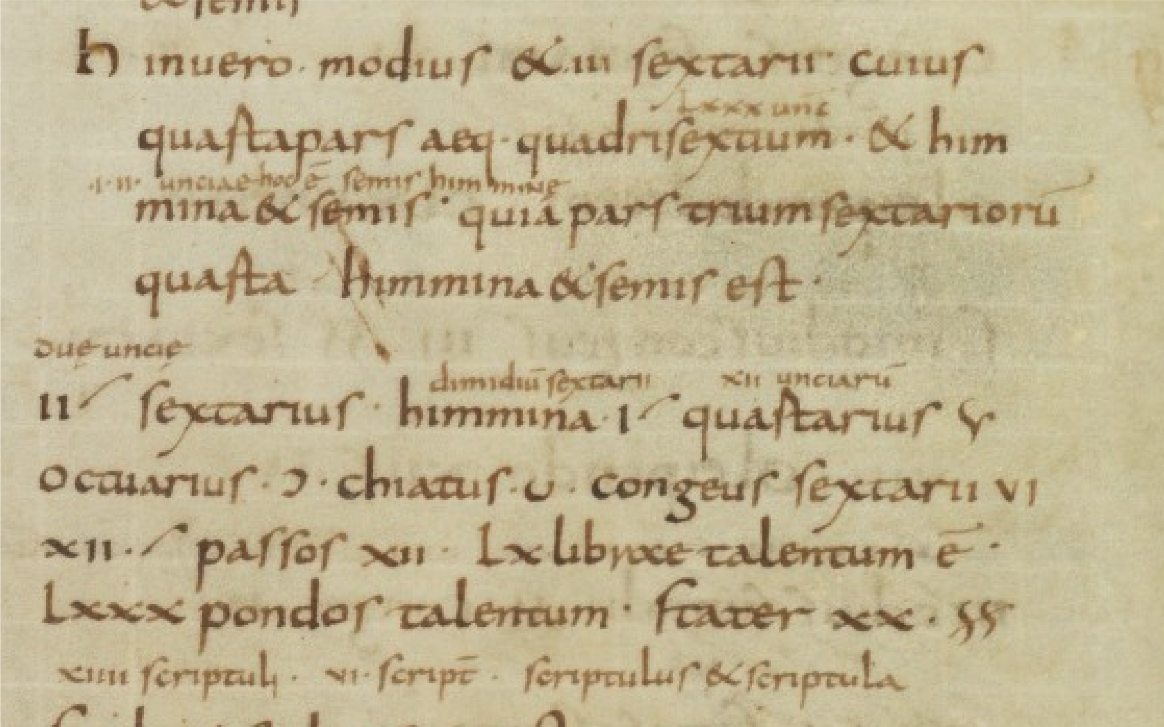
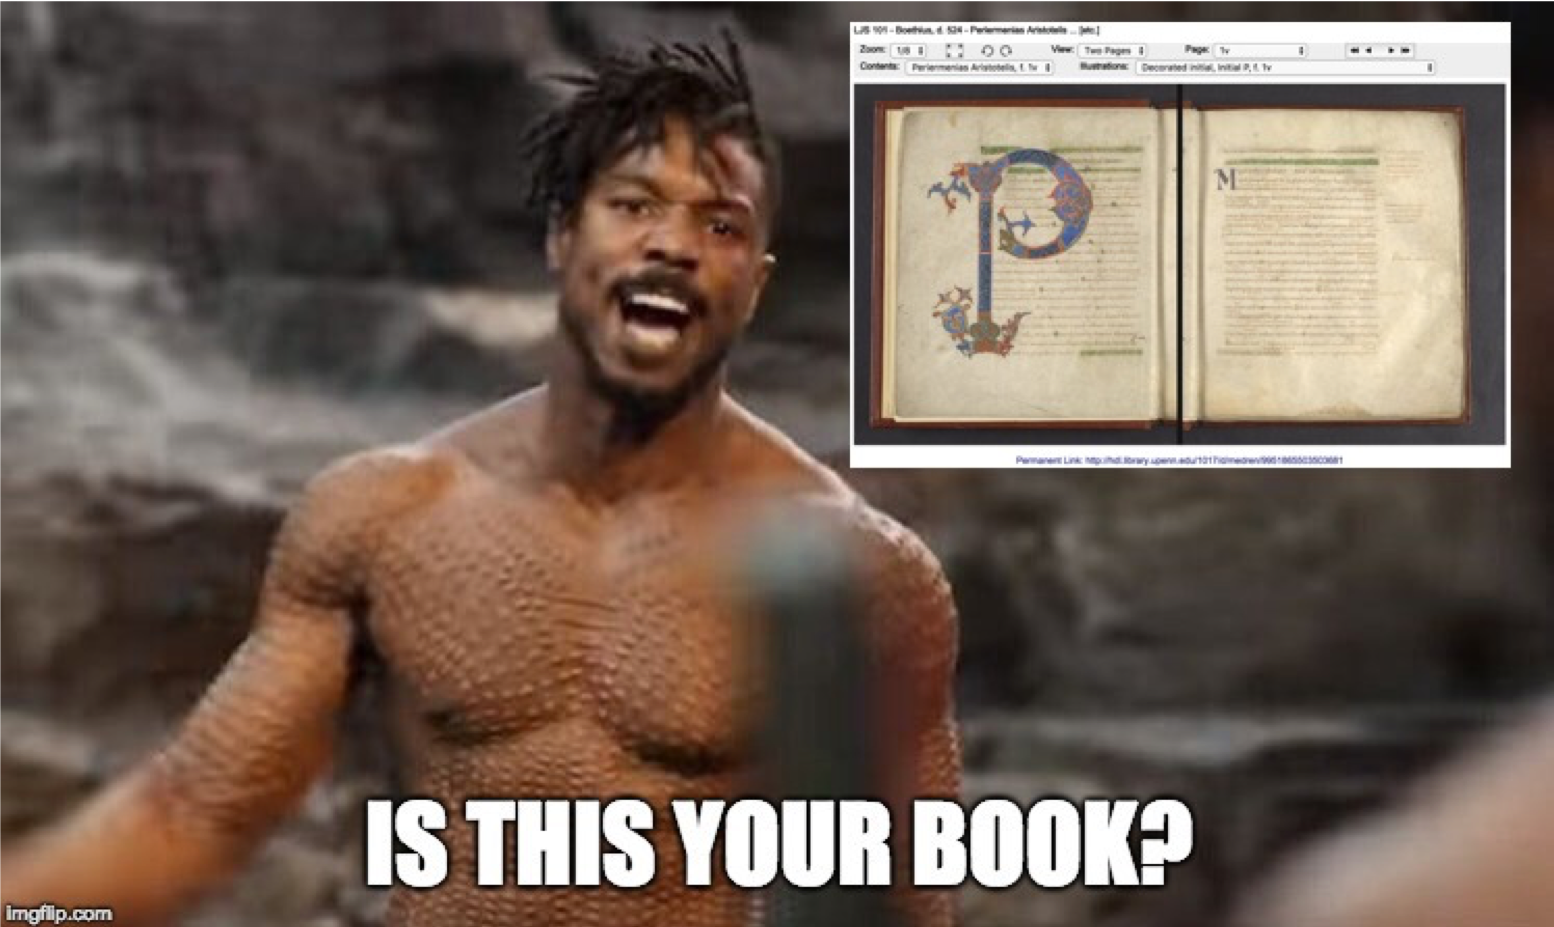
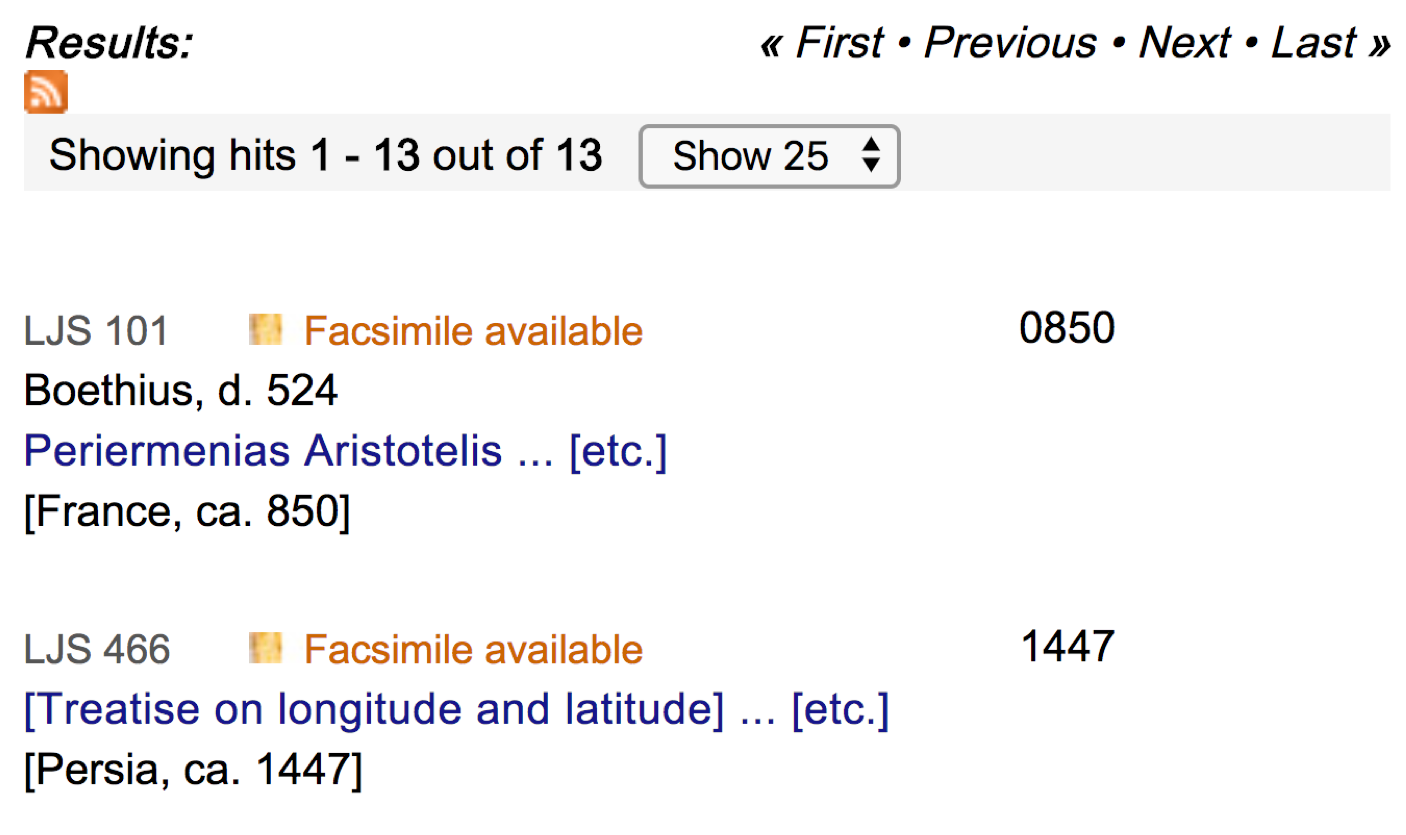
For my paper at the International Medieval Congress at Leeds earlier this summer I used the manuscript University of Pennsylvania LJS 101 as an example of “medieval manuscript as transformative work,” not as a piece of data to be mined for its texts, but as a transformative work in itself, centered around a language of care. I’m not comfortable applying the concept of affective reception to the people who created and worked with medieval manuscripts – I don’t want to suggest that these people loved the manuscript the same way that I do – but I do want to explore the idea that this person or people cared about them, and that other people have cared about these manuscript over time enough that it survives to live now in the libraries and private collections. Their interests may have been scholarly, or based on pride of ownership, or even based on curiosity, but whatever their reasons for caring for the manuscript, they did care, and we know they cared because of the physical marks that they have left on these books. Manuscripts that survive also often show examples of lack of care, damage and so forth, so those elements need to be included in this framework as well.
However, for this paper I want to suggest that we consider that manuscripts relate to digitized manuscripts within the framework of Transformative Works in the same way that so-called canon works relate to fan works. In this framework, we design and build visualizations and interfaces for digitized manuscripts in the same way that fans create fan fiction and fan art: by respecting the canon but adding something new, with a further purpose, altering the source with new expression, meaning, or message. Such visualizations or interfaces would be embodiments of Dr. Wilson’s concept of affective reception. They may look and function similar to scholarly interfaces, and may even be able to be used for scholarship, but they would primarily be designed to elicit an emotional response from the user.
The Ghost in the Machine
And now we get to our discussion of The Ghost in the Machine, which was a term coined by philosopher Gordon Ryle in 1949 to describe the concept of mind-body dualism, that is, that the human mind and the body are distinct and separable.
In the last chapter of 2008’s Printing the Middle Ages, “Coda; The Ghost in the Machine; Digital Avatars of Medieval Manuscripts,” Sian Echard talks of “the ominous implications of the phrase ‘the ghost in the machine’” in the consideration of modern reception, particularly digital reception, of medieval manuscripts. As she notes in her footnote, “the phrase has become a commonplace of digital popular culture and reflection on it, and I use it in that spirit here. It will become clear, however, that the phrase’s origins in discussions of Cartesian dualism are oddly relevant to a consideration of the dis- and re-embodiment of medieval text-objects in digital avatars.”
The idea of applying the concept of the Ghost in the machine, that is the separability or inseparability of the mind of the manuscript and the body of the manuscript, brings to mind a few other, perhaps similar ways of thinking about art and communication. In preparing for this talk I read, in addition to Echard’s piece quoted from a minute ago, both Walter Benjamin’s “The Work of Art in the Age of Mechanical Reproduction” his 1936 treatise on what photography means for art, and Marshall McCluhan’s chapter “The Medium is the Message” from his 1964 book Understanding Media: The Extensions of Man. There are a few things from these texts that I think are relevant for an application of the Ghost and the Machine to a discussion of manuscripts and digital manuscripts.
Benjamin is concerned, among other things, with the aura of a work of art, which he at one point defines as its uniqueness, closely related to its authenticity. Because of the nature of photography (one of the means of mechanical reproduction identified by Benjamin) it is simply not possible to reproduce the aura of an artwork, because art exists in the world, and reproducing a piece of art in a photograph takes it out of that world. In his words,
“Even the most perfect reproduction of a work of art is lacking in one element: its presence in time and space, its unique existence at the place where it happens to be. This unique existence of the work of art determined the history to which it was subject throughout the time of its existence. This includes the changes which it may have suffered in physical condition over the years as well as the various changes in ownership. The traces of the first can be revealed only by chemical or physical analyses which it is impossible to perform on a reproduction; changes of ownership are subject to a tradition which must be traced from the situation of the original.”
McCluhan, on the other hand, is more concerned with how information is conveyed to us – the medium being the physical conveyance of the message, which he makes pains to point out is different from the content, which is something else altogether. In fact, he says, “the ‘content’ of any medium is always another medium. The content of writing is speech, just as the written word is the content of print, and print is the content of the telegraph.” The message instead is “the change of scale or pace or pattern that it introduces into human affairs.” So the message for us isn’t the text or illustrations in a manuscript, the message is the means by which that content makes it to us through whatever medium.
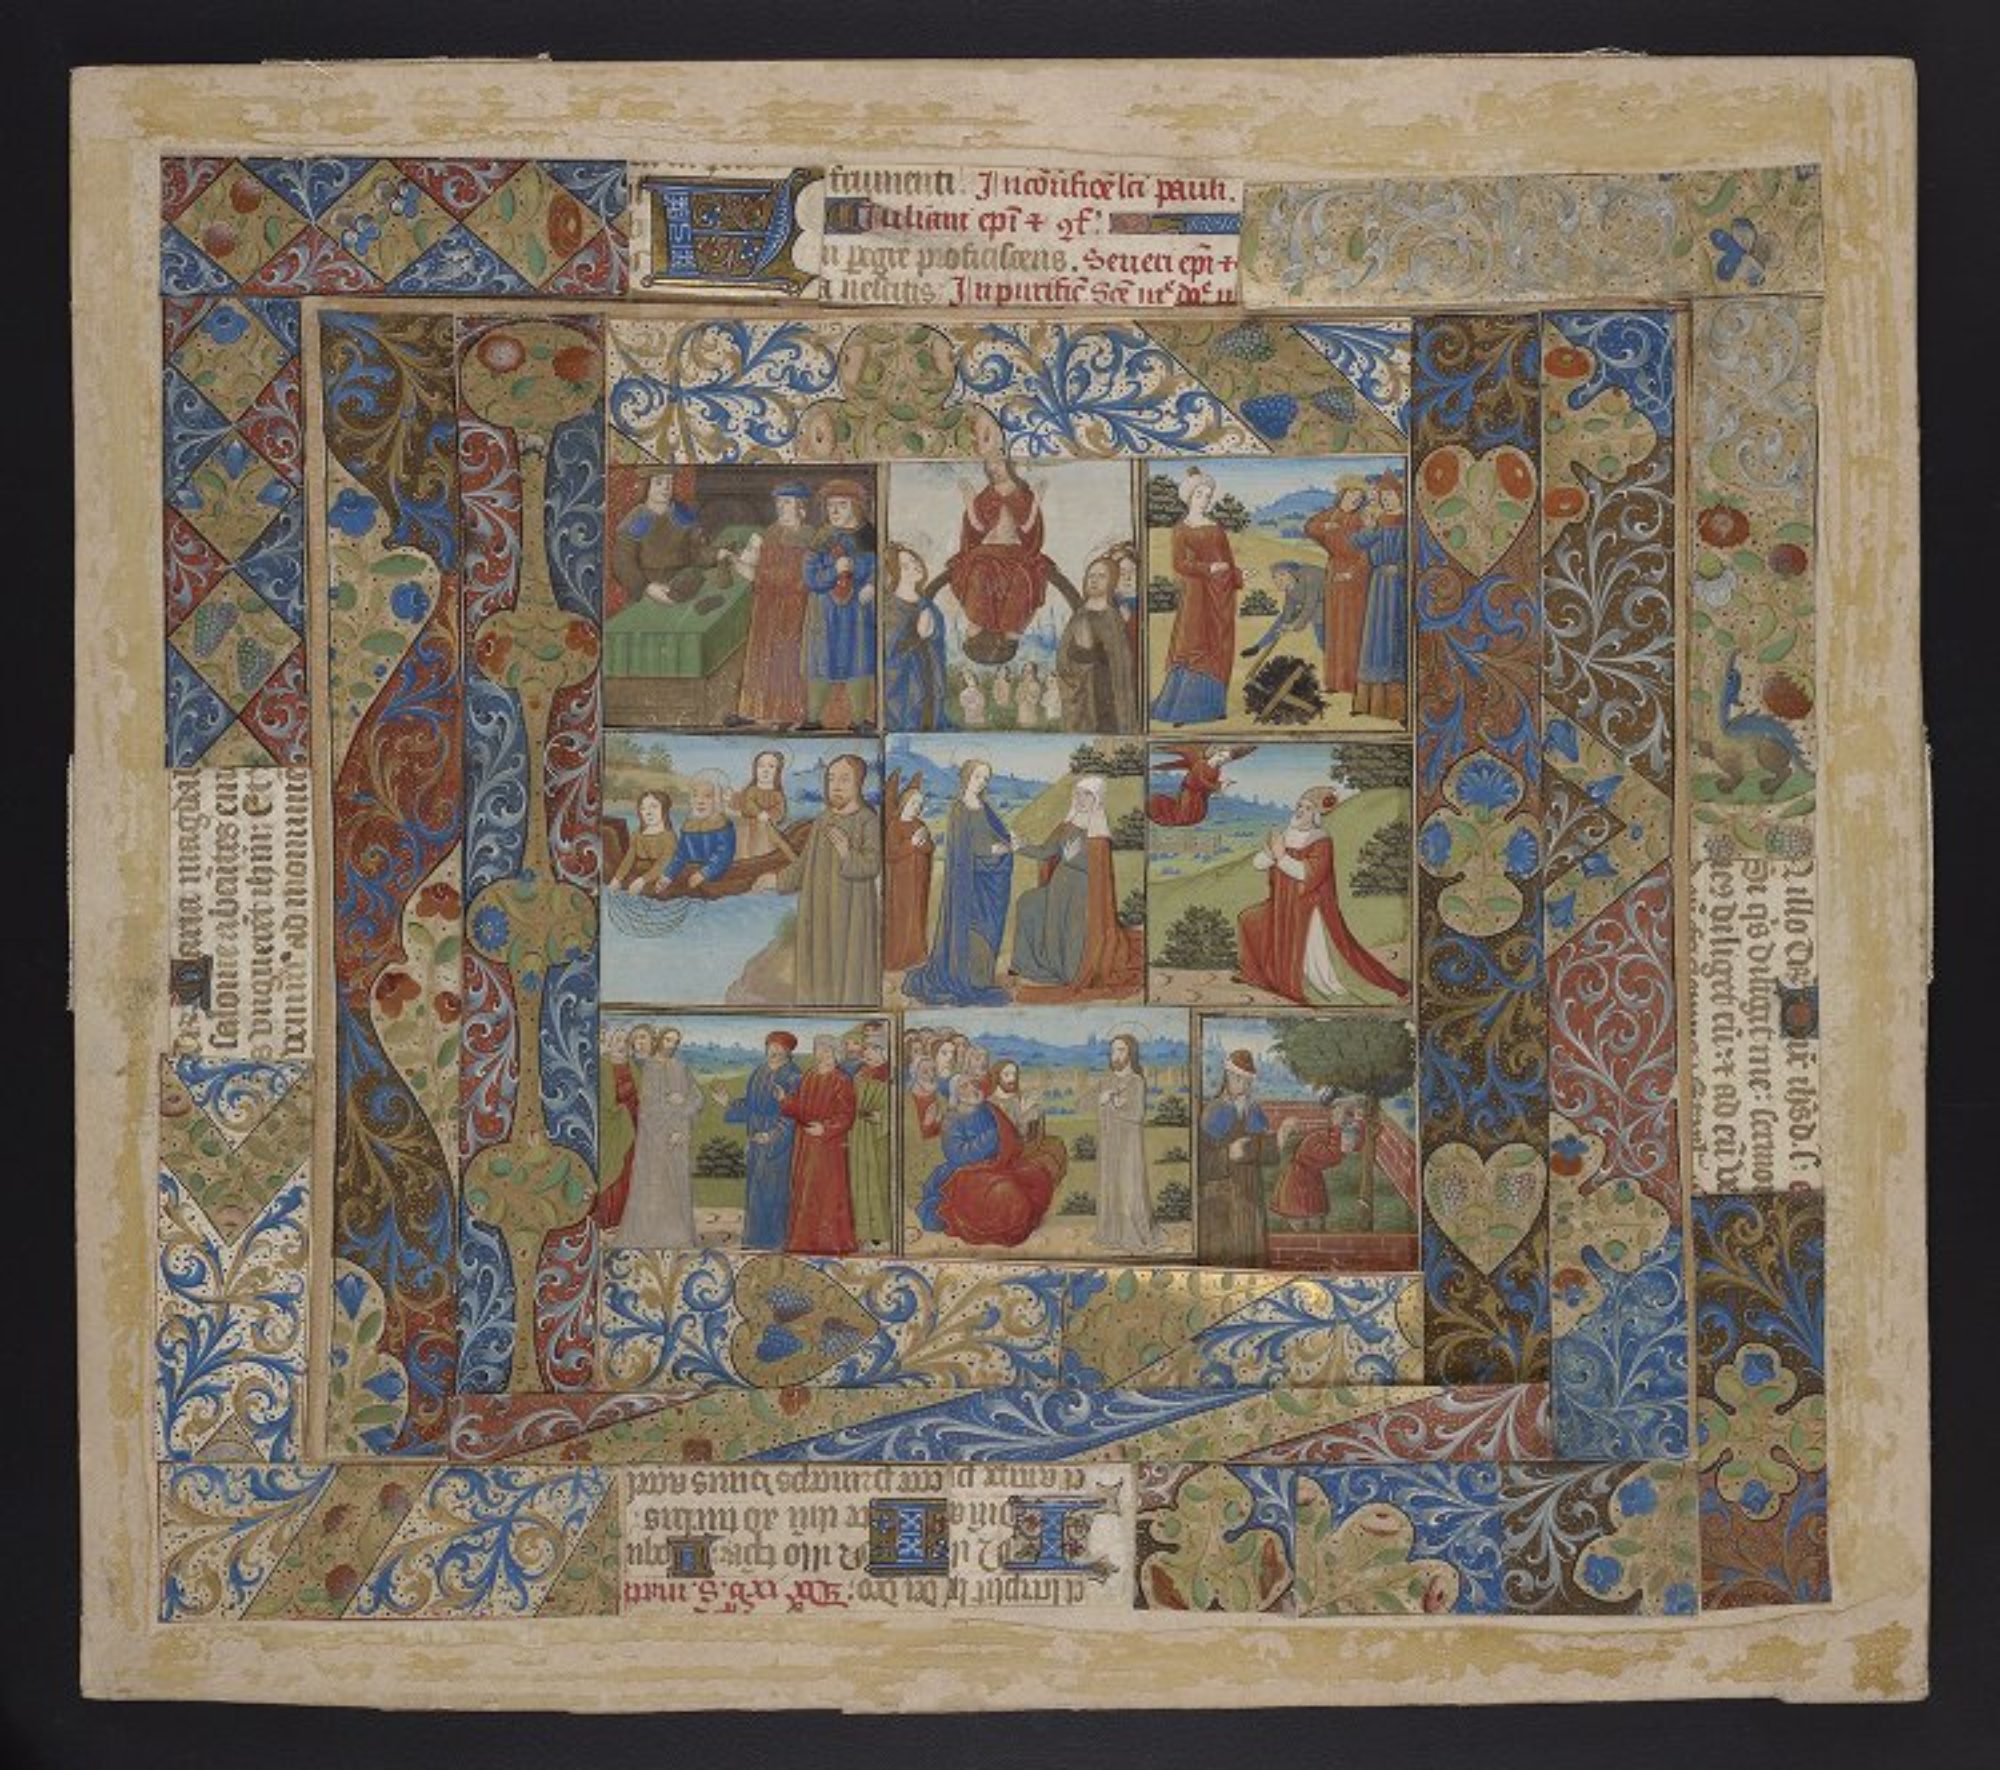
For example, the medium could be a 15th century Book of Hours, but the message is that the Psalms are divisible into groups, the Penitential Psalms are one such group, and at this point in time it was important for these Psalms to be set apart in these Books using some agreed upon conventions. That is the message. The message of a digital photograph of the Penitential Psalms is altogether different, because the medium is different. The medium is bits and bytes, arranged through a system of machines, to display something that looks like those pages in that Book of Hours. The concept of digital photography as a medium with a message is very similar to McCluhan’s description of electric light:
For it is not till the electric light is used to spell out some brand name that it is noticed as a medium. Then it is not the light but the “content” (or what is really another medium) that is noticed. The message of the electric light is like the message of electric power in industry, totally radical, pervasive, and decentralized.
Likewise, I think, the medium of pervasive digital photography for medieval manuscripts is radical for us today. We are creating relatively massive amounts of fragmentary data about our manuscripts. What do we do with it?
What the analogy of the Ghost and the Machine forces us to do first is to determine what is the ghost, and what is the machine. Being informed by Benjamin’s concept of the aura, McCluhan’s concept of the medium and the message (distinct from content), Dr. Wilson’s concept of affective reception, and also the relationship between affinity and “manuscript-ness” in the uncanny valley, I’d like to propose that the ghost of a manuscript is very close to Benjamin’s concept of the aura, and that the aura is what informs our affinity towards any interface, and is also what we as humans are set to respond to emotionally. The aura, the ghost, is what makes a manuscript unique, and what allows us to identify it. Earlier, when talking about the uncanny valley, I mentioned that if you had Ms. Codex 1056 in your hands tomorrow it would look different that it did in the video I showed you. That difference between what you would see in your interactions with the manuscript, and what you see in my video, that’s the ghost. And it is, I think, impossible to reproduce the ghost of the manuscript, and impossible to visualize it completely in any digital interface I can comprehend.
What we can do, though, is reproduce aspects of the machine – that is, the manuscript stripped of its ghost, removed from time and space and placed in a kind of virtual vacuum – and use those to construct something that gives us insights into the parts of the ghost that aren’t themselves reproducible. As we do this we can also be mindful of what emotional responses the interface might provoke in the users.
To be fair to those of us providing access to digitized manuscripts, the first part of this – reproducing aspects of the machine – is pretty much what we’re doing now and what we’ve always done, although from my experience the thinking that happens around the digitization process is really quite prosaic, literal, practical, and we don’t think enough about how digitization or other photographic reproduction presents us with something that is very different from the manuscript while still telling us something about it. For example
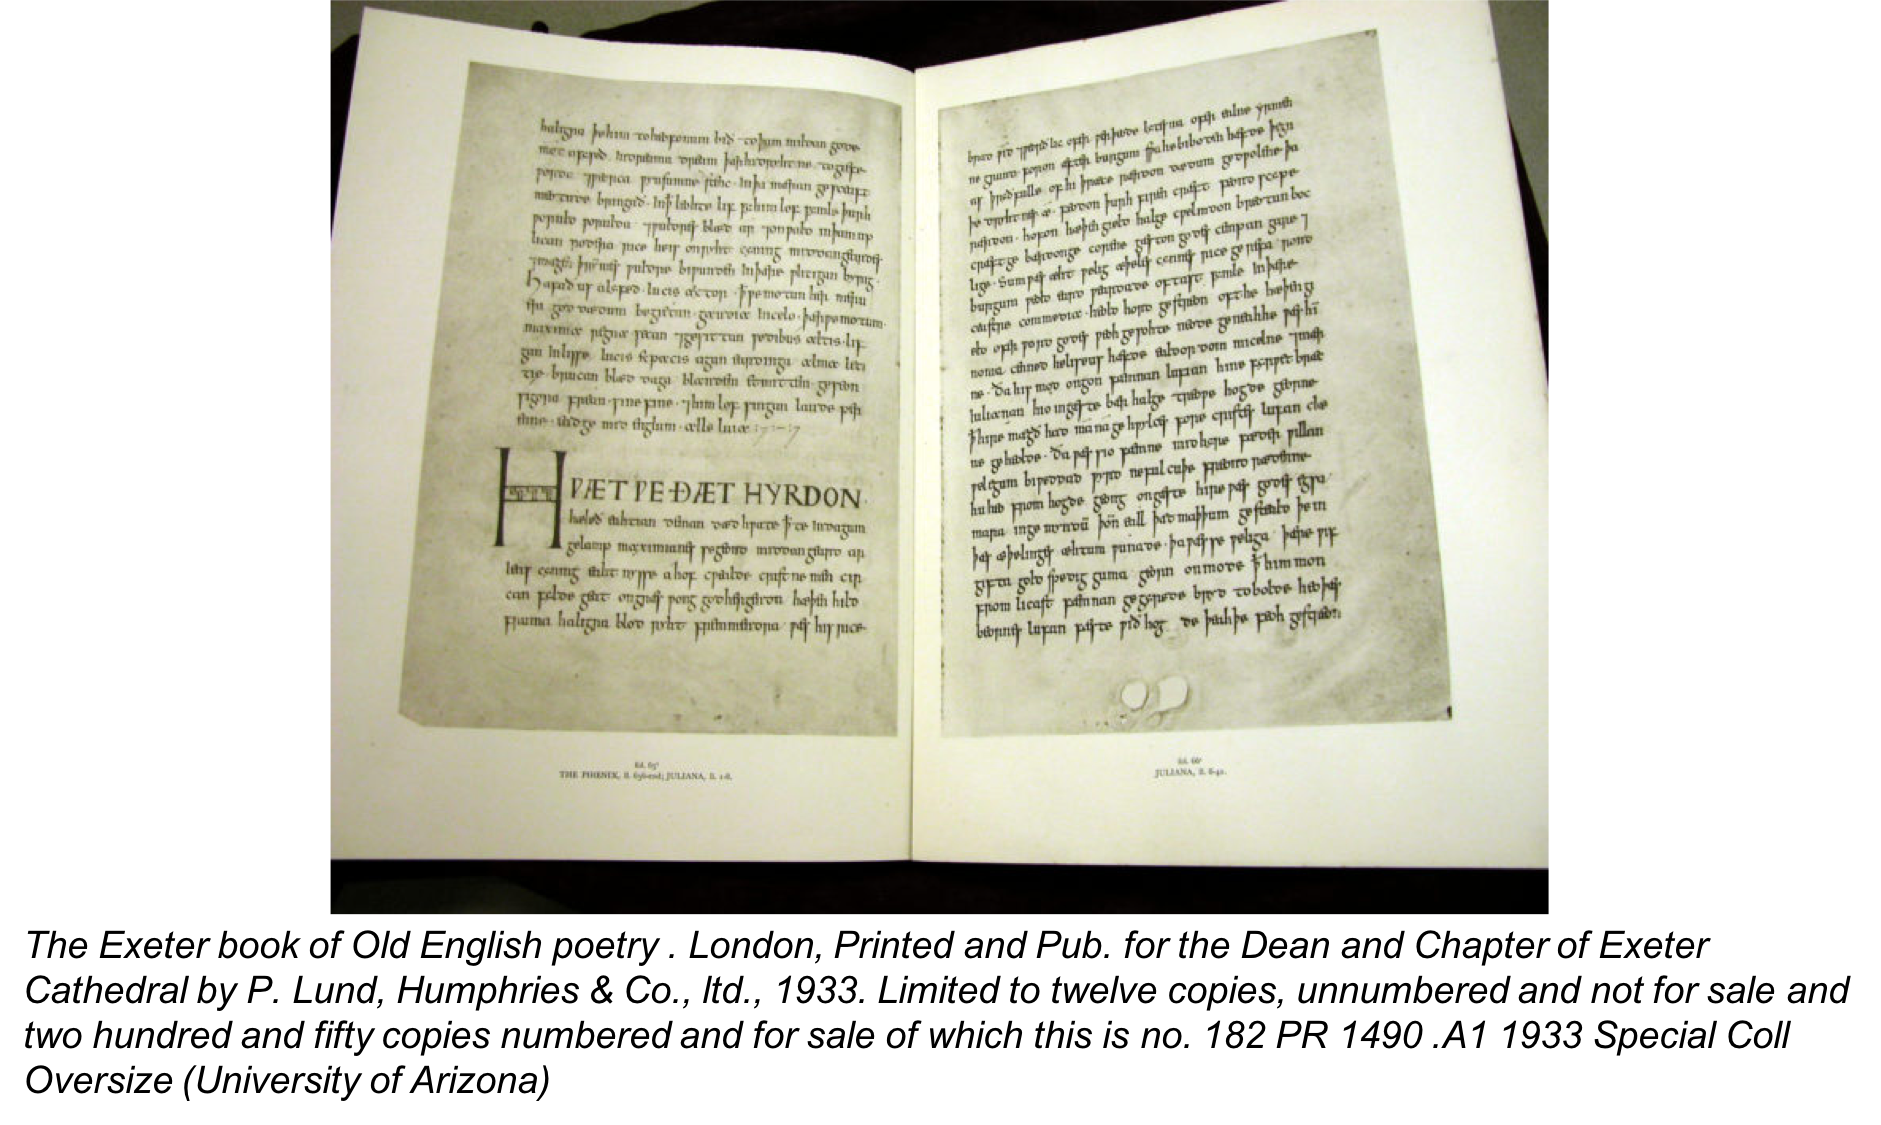
Early facsimiles that present the folios disembodied and set within pages of a modern book. You can read the text but don’t get a real sense of the physicality of the manuscript.

Microfilm, designed for access to the text, giving in most cases even less of a sense of the physical object.

Luxe facsimile, designed to give an impression of the physical book, although in most cases the quire structure and physicality is not exactly like the original.
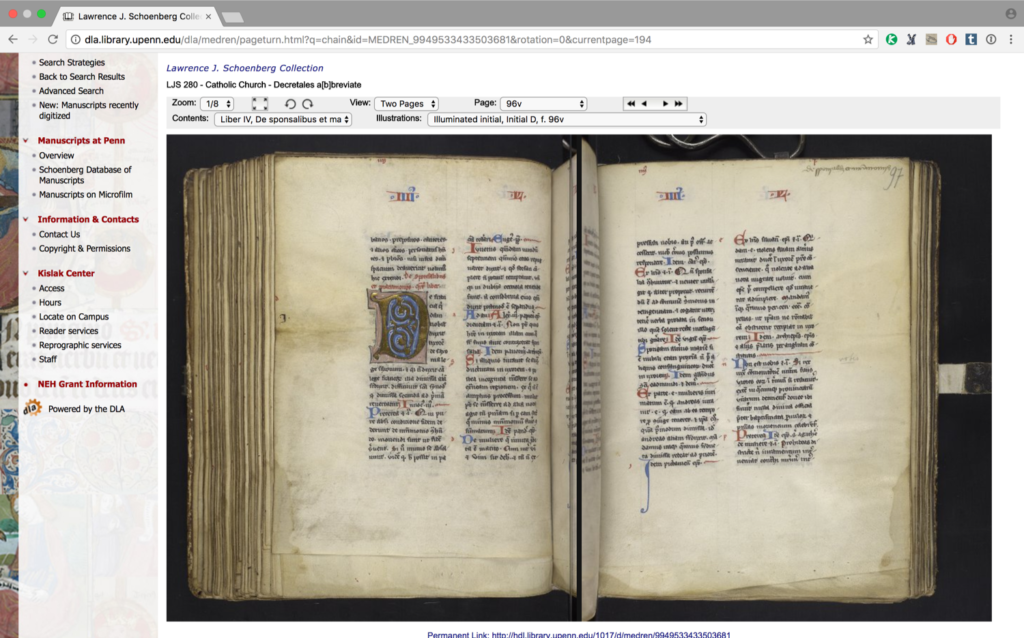
Digital images presented in a page-turning interface to give the impression of the page opening, can be zoomed in on for reading, although the photography is high-res the images are only of the page, and the binding is photographed separately, so you don’t get a sense of the book as a three-dimensional object.
Digital images presented in a page-turning interface focused on the movement of the electronic page, although the movement doesn’t correspond with the movement of the physical manuscript.
Interactive 3D images that model the topography of the page, but without the context of the full manuscript. This is a miniature of St. Luke from Bill Endres’s Manuscripts of Lichfield Cathedral project.
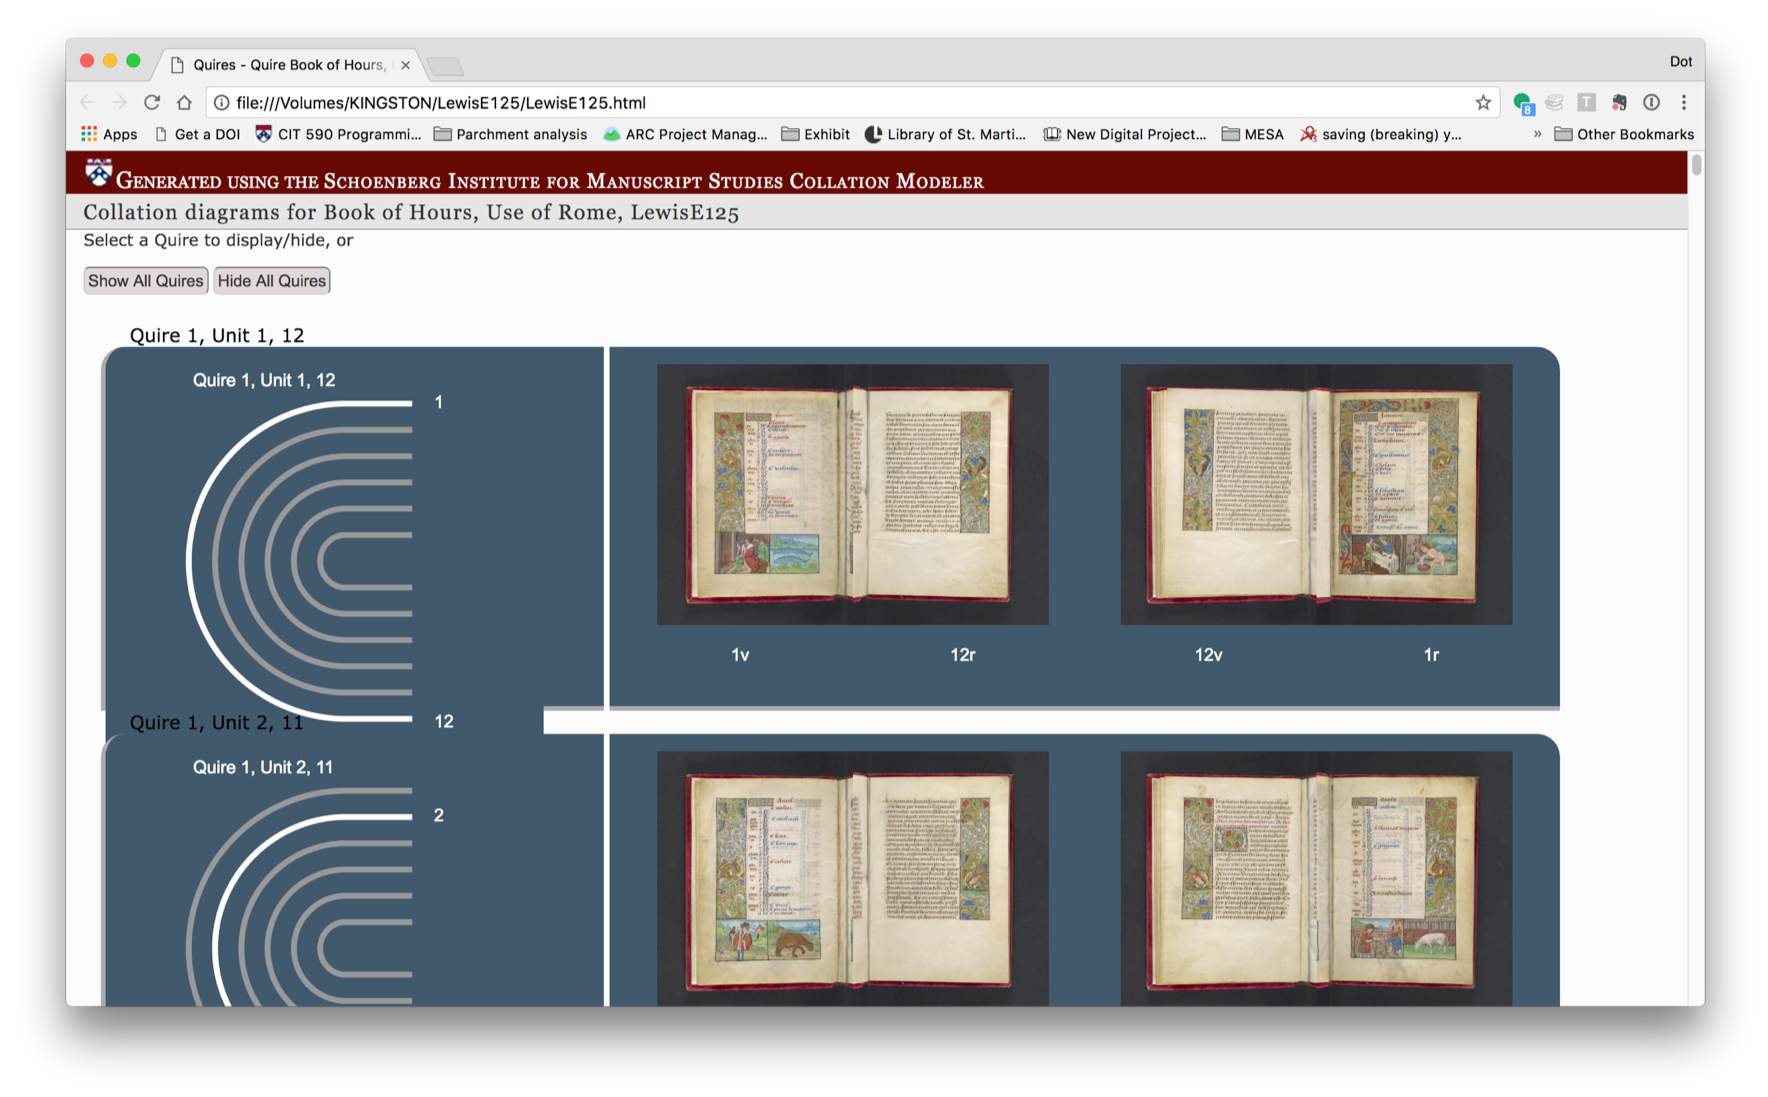
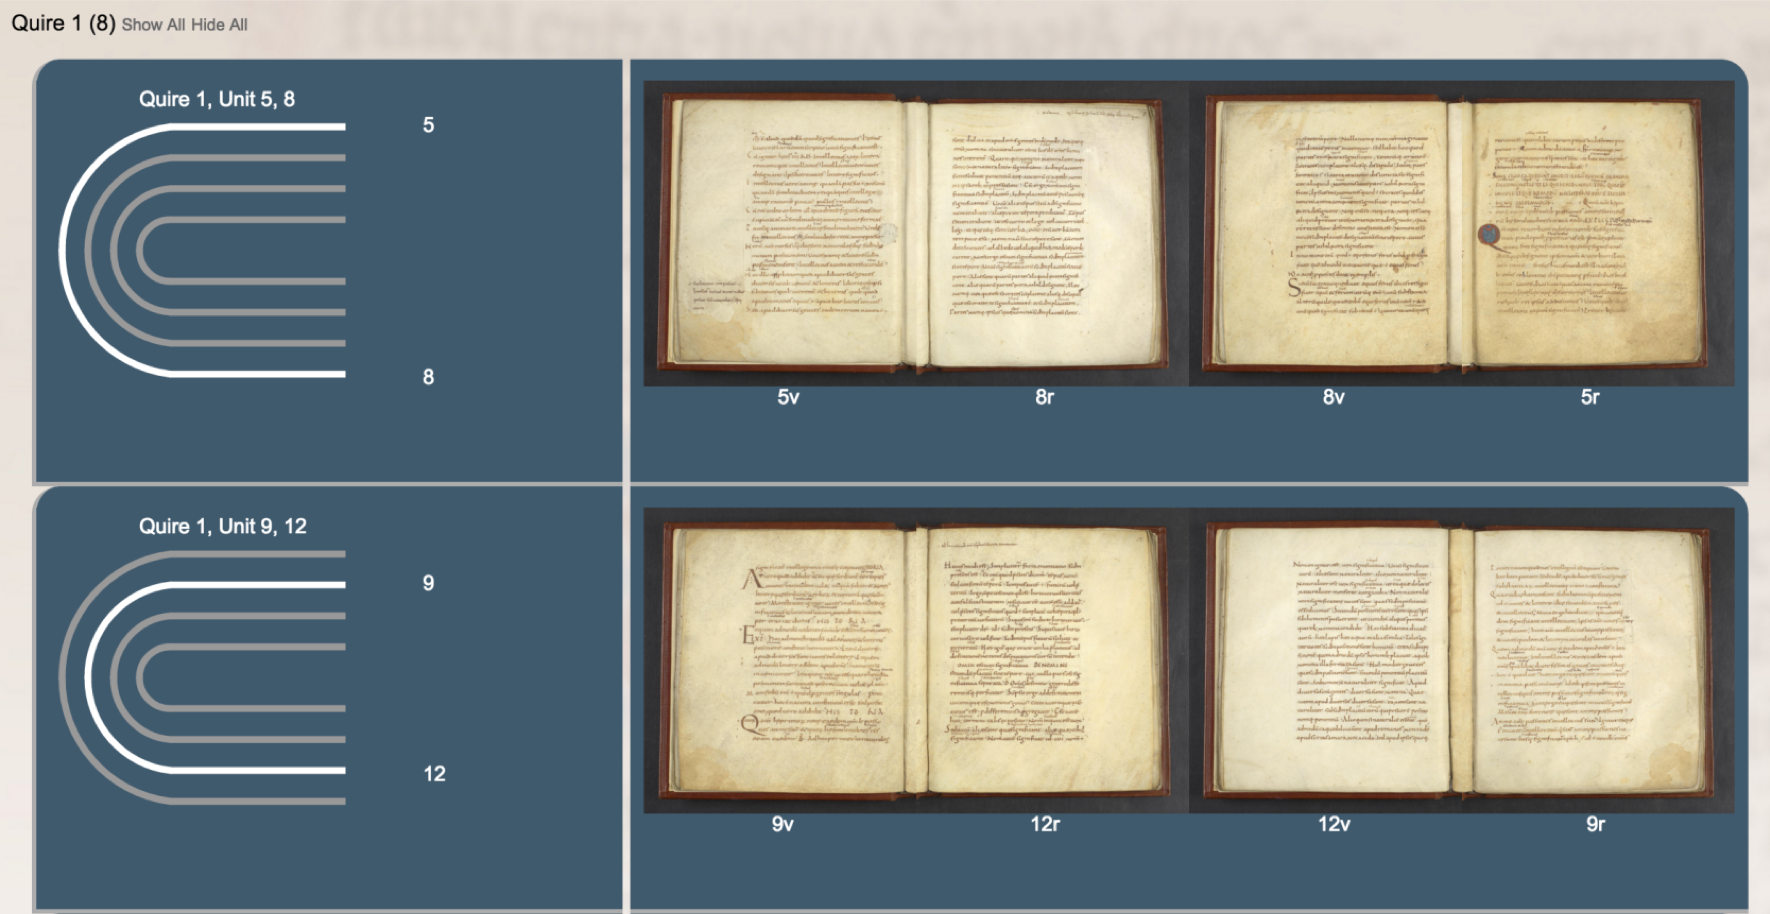
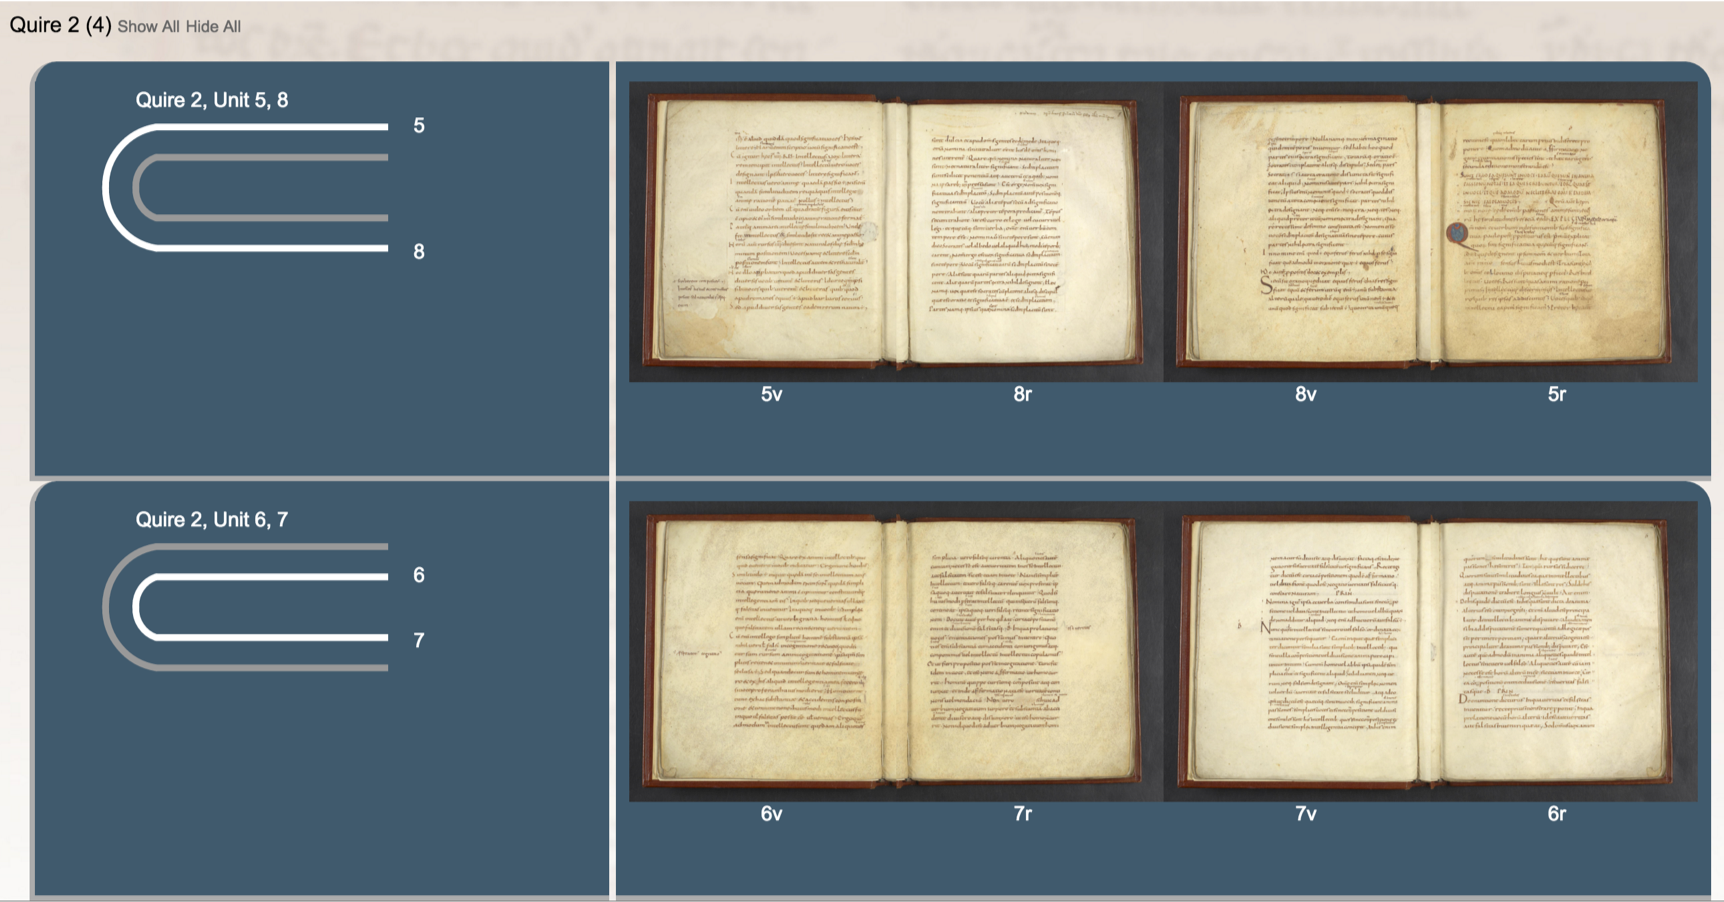
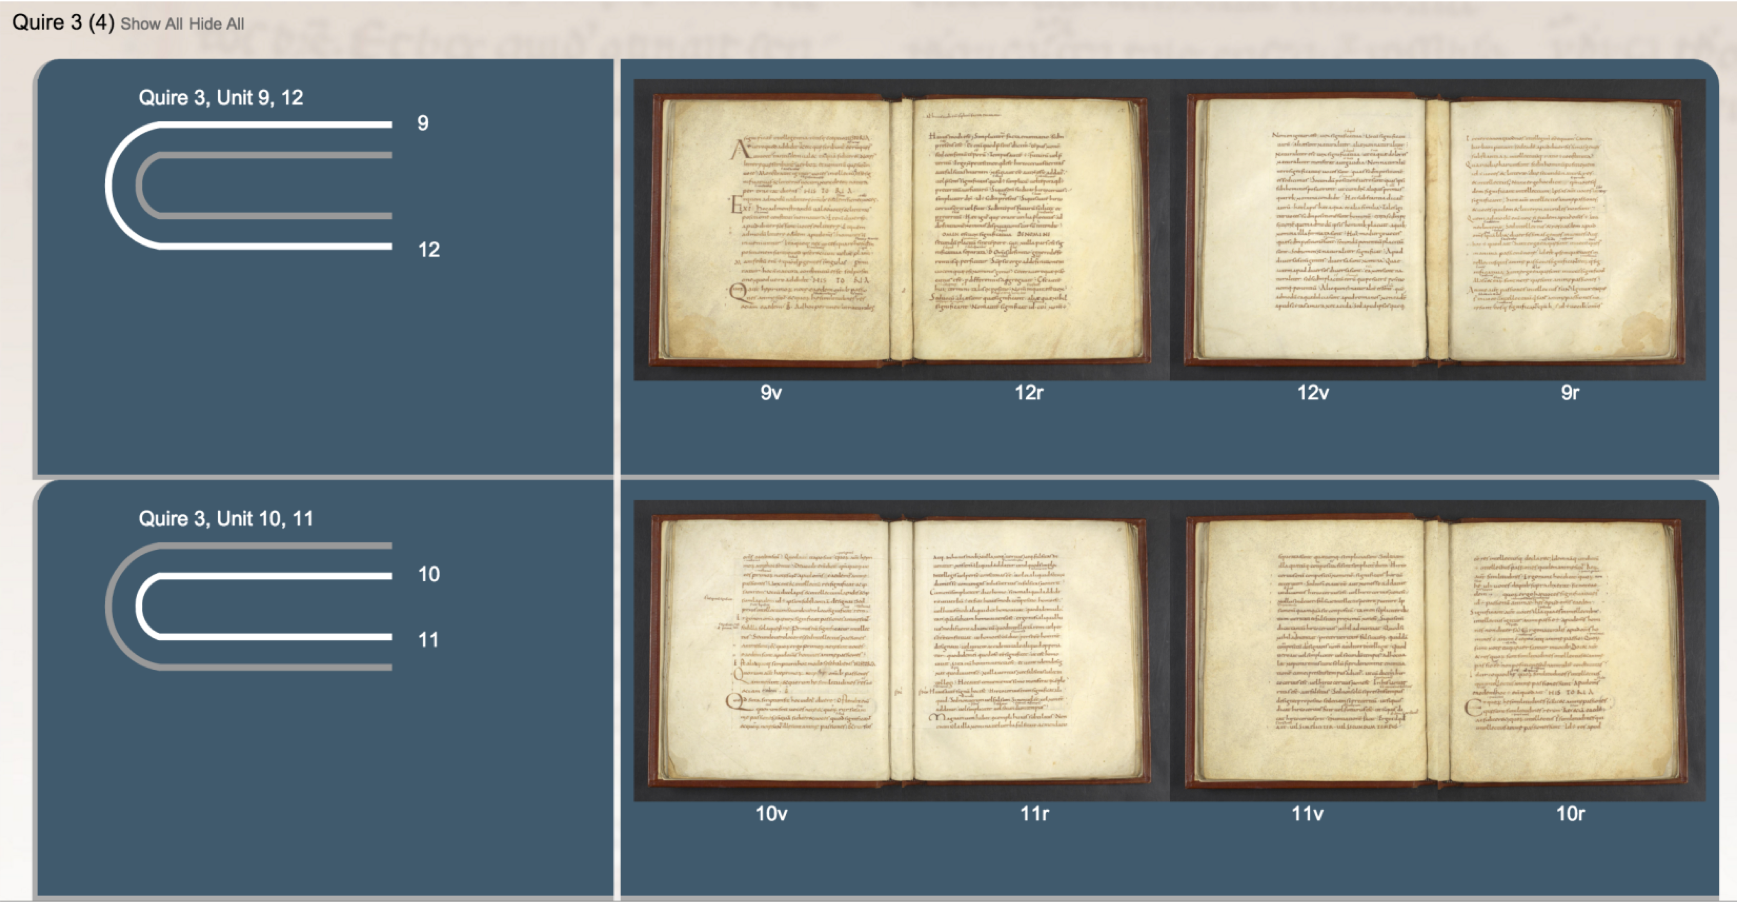
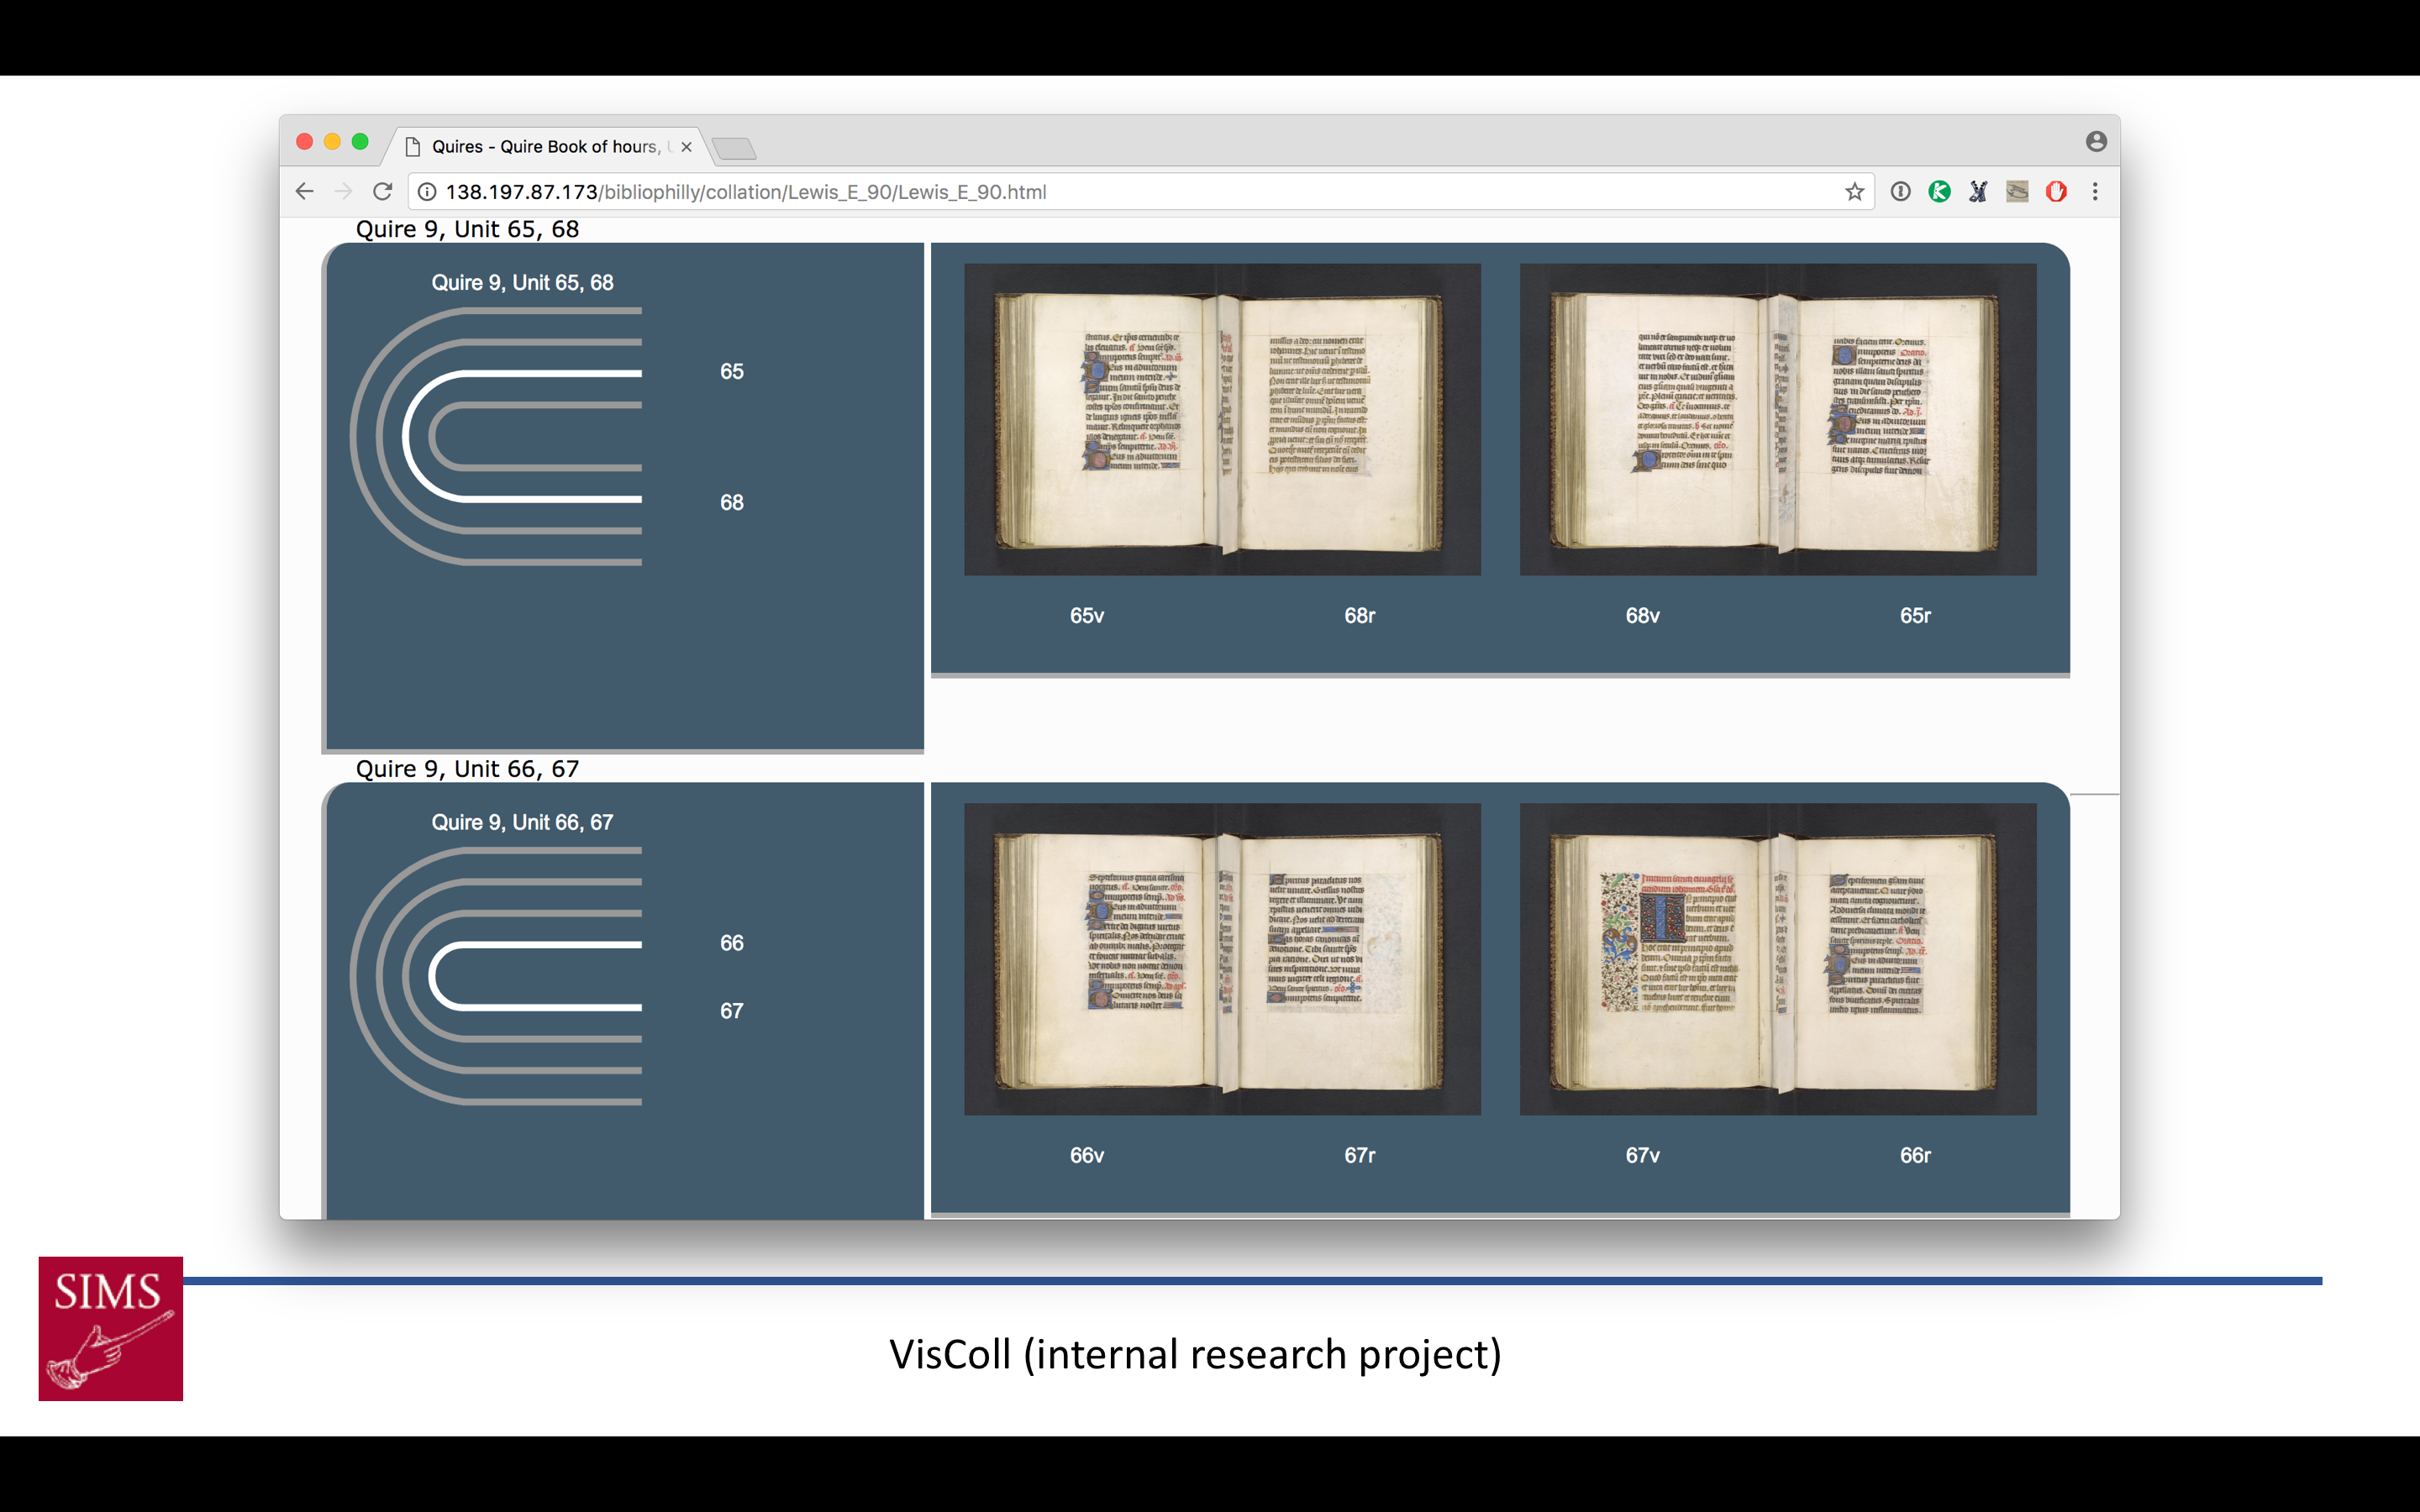
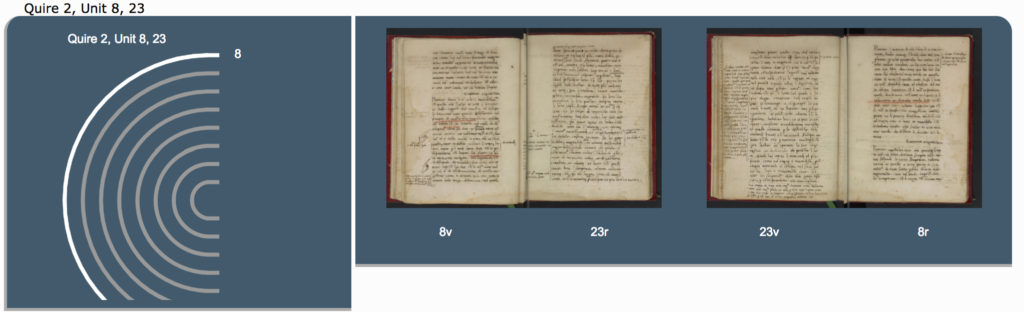
A visualization using VisColl, a project out of SIMS, which models and visualizes the physical construction of manuscripts, generating quire diagrams and using digitized folio images to reconstruct conjoins.
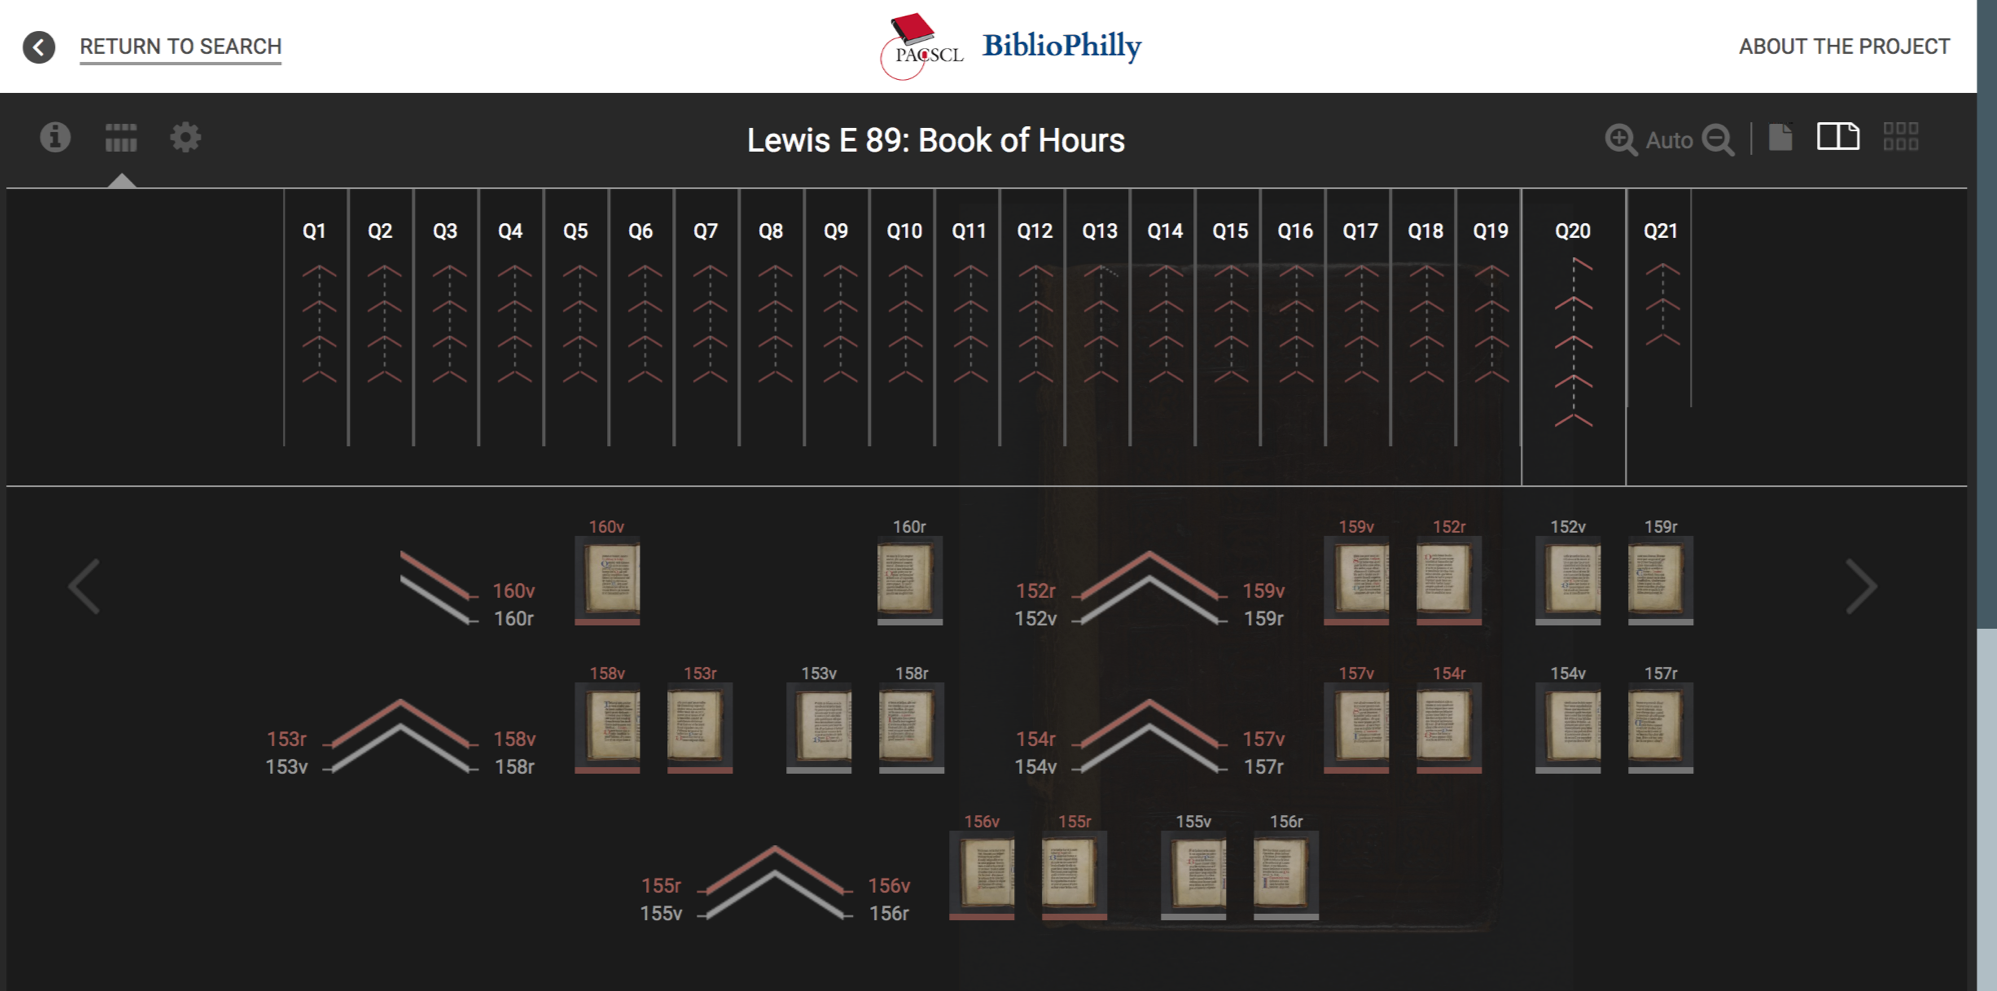
The VisColl system integrated into the BiblioPhilly interface I showed you at the beginning of the talk, so you can get a sense of how the manuscript is constructed alongside the more usual facing-page view
Each of these interfaces, whether consciously or not, has been designed to illustrate some aspect of the manuscript and to ignore others. What I’d like to suggest is that we simply start being conscious of our choices as we design and build interfaces. Going back again to the uncanny valley, this is what Mori would call Escape by Design.
Uncanny Valley: Escape by Design
Mori proposes that designers focus their work in the area just before the uncanny valley, creating robots that have lower human likeness but maximum affinity. He says:
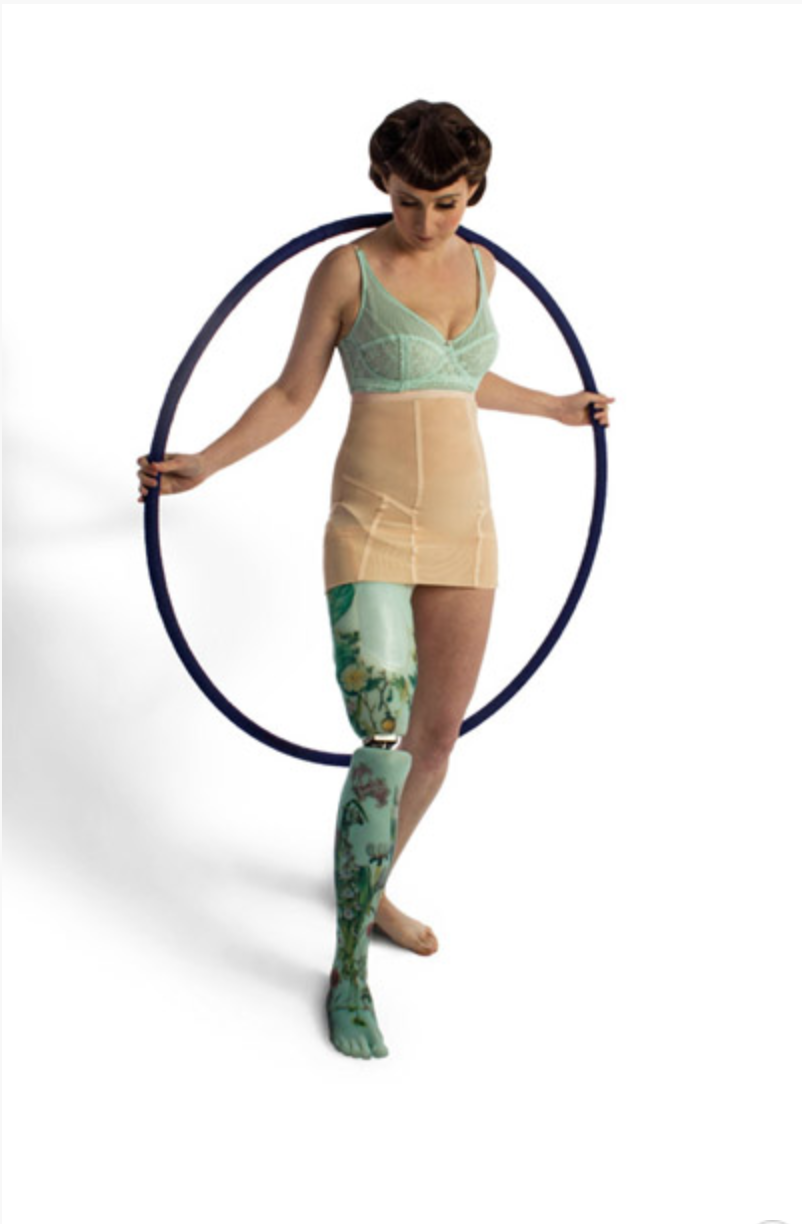
In fact, I predict that it is possible to create a safe level of affinity by deliberately pursuing a nonhuman design. I ask designers to ponder this. To illustrate the principle, consider eyeglasses. Eyeglasses do not resemble real eyeballs, but one could say that their design has created a charming pair of new eyes. So we should follow the same principle in designing prosthetic hands. In doing so, instead of pitiful looking realistic hands, stylish ones would likely become fashionable.
So after a lot of philosophical thinking, this gives us something practical to aim for. Let’s build page-turning interfaces that are conspicuous in their use of flat digital images, let’s do more with 3D, RTI, and MSI to show us parts of the manuscript we can’t see under regular institutional photography, let’s do more work using data about the manuscript to organize our flat images in new and interesting ways, all with a mind towards informing us about that unreproducible ghost.
Now, this is an ideal, and there are practical reasons this won’t always work. Interface design and development is expensive, and we – the librarians responsible for the digitization – usually aren’t the ones building the interfaces. We’re using interfaces other people build for us, either we buy them a company or we participate in consortia like the International Image Interoperability Framework, IIIF Consortium, which provides open access tools for the community. Very few institutions have the wherewithal to build their own interfaces from scratch. At Penn we’re very lucky, so the interfaces I’ve shown you today VisColl for visualizing the quire structures, and the BiblioPhilly interface with that integrated, are open source code so could be adapted by other institutions. But that adaption work also requires resources. There’s no free answer here.
There’s also the issue of the data itself. Manuscript digitization happens systematically, with each book getting a very specific set of flat images out the other end (every page gets one image, front and back cover, hopefully the edges and spine but not all libraries include those shots in their usual workflow) so it’s not usually possible to take the time to point out interesting anomalies (imagine a bookmark that is conspicuous when you’re sitting down with the book, but which goes unphotographed because it’s not listed in the list of shots provided to the photographer). And 3D modeling, RTI, MSI, are not available to most library digitization facilities, and even if they were there would need to be policies and procedures to determine which manuscripts get such special treatment and which don’t. So it’s great for me to stand up here and say this is what we should do, but a whole other thing to do it in any practical way.
I’m over time, I’m sorry, so I’ll just close here with the question that keeps me up at night. I’d like to talk to you about this and see if you have ideas or suggestions, or if you think this is moving in the right direction. Thank you.